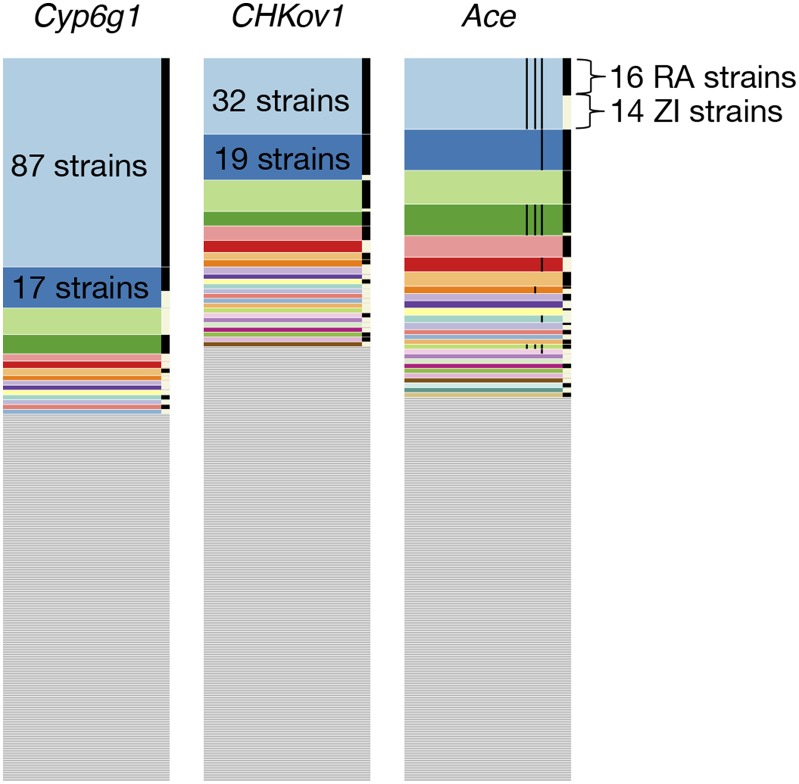
Figure 4.
Haplotype frequency spectra at Cyp6g1, CHKov1, and Ace. Shown are haplotype frequency spectra at the three positive controls in a joint data set, comprising 300 Raleigh strains and Zambian strains in 801 SNP windows positioned at the sweep centers. 801 SNP windows in the joint data set correspond to a slightly smaller analysis window size (<10 kb) in terms of base pairs on average than in the Raleigh or Zambian data alone. On the right side of each of the frequency spectra are black and white bars, indicating which strains are from Raleigh (RA) and Zambia (ZI), respectively. At all three positive controls, common haplotypes are shared across the two populations. The thin black lines shown in the haplotype spectrum for Ace correspond to the presence of three adaptive mutations that confer resistance to pesticides at Ace. Three haplotypes have all three adaptive mutations. Raleigh and Zambian strains share two of these haplotypes.

