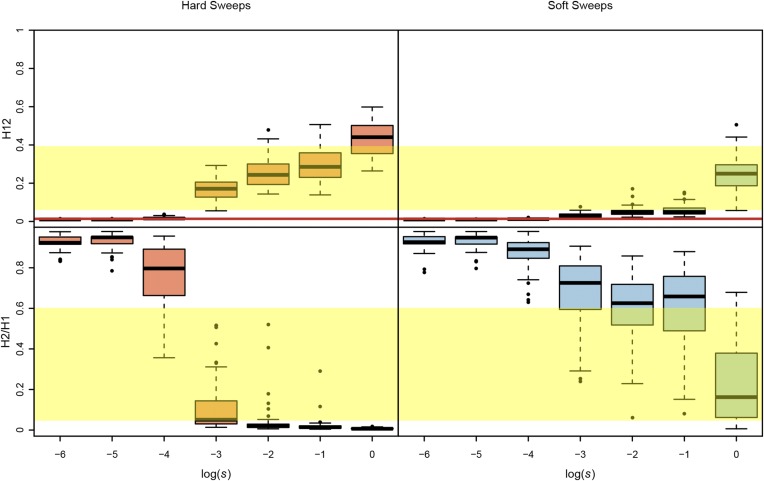
Figure 6.
H12 and H2/H1 measured in sweeps of varying selective strength. Hard and soft sweeps were simulated with θA of 0.01 and 10, respectively, and with selection strengths (s) ranging from 10−6 to 1. All simulations were conducted with a ρ = 0.5 cM/Mb in a sample size of 145 individuals and with a constant Ne ≈ 2.6 × 10⁶ model fit to Raleigh data (see Materials and Methods). Each boxplot comprises 100 simulations with the frequencies of the adaptive allele ranging from 0.4 to 0.6. The yellow region shows the range of H12 and H2/H1 values observed in Raleigh data at the top 25 peaks. The red line shows the one-per-genome FDR value of H12 measured under neutrality with the Ne ≈ 2.6 × 10⁶ model (File S1). H12 values are distinguishable from neutrality only when s ≥ 10−3. Hard sweeps can generate high H12 and H2/H1 values in the scenario when s = 10−3. However, this changes when ρ = 5 cM/Mb (Figure S6), whereby sweeps are distinguishable from neutrality only when s ≥ 10−2 and hard sweeps can generate high H12 and some high H2/H1 values when s = 10−2.

