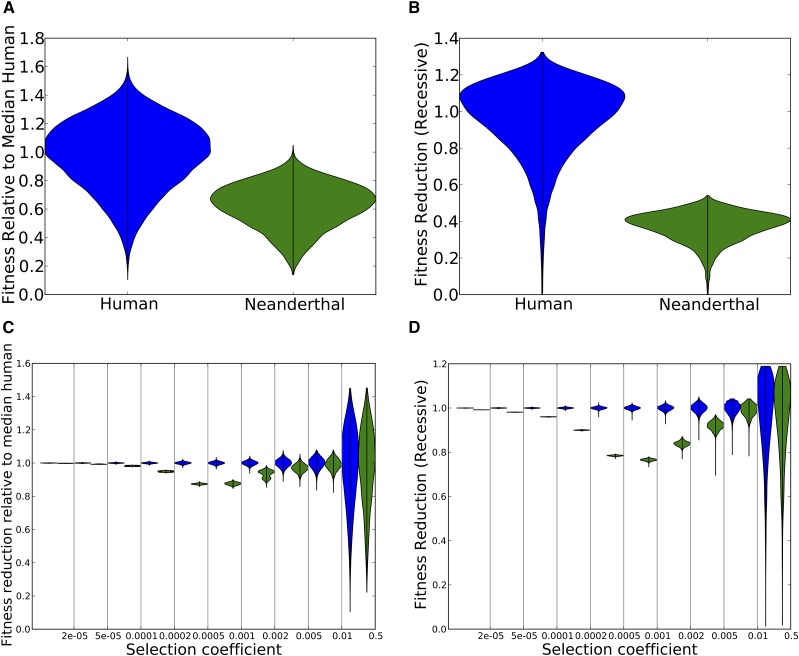
Figure 1.
(A) The distribution of fitness in Neanderthals vs. nonadmixed humans, assuming that their effective population sizes differed 10-fold since their divergence 16,000 generations ago and assuming additive mutation effects. After simulating the two populations using SLiM, we calculated each individual’s fitness relative to the median human. The violin plots of the two distributions show significant variance within each population but lower fitness in Neanderthals. (B) The same as in A but for a model of recessive mutations. C and D show the same data as in A and B, respectively, but stratified into different bins of selection coefficients. The fitness reduction due to mutations with s between and is much greater in Neanderthals than in humans. In contrast, the fitness reduction due to very weak effect mutations is similar between the two populations, as is the fitness reduction due to strongly deleterious mutations with This is expected as mutations outside this range are either effectively neutral in both populations or strongly deleterious in both populations.

