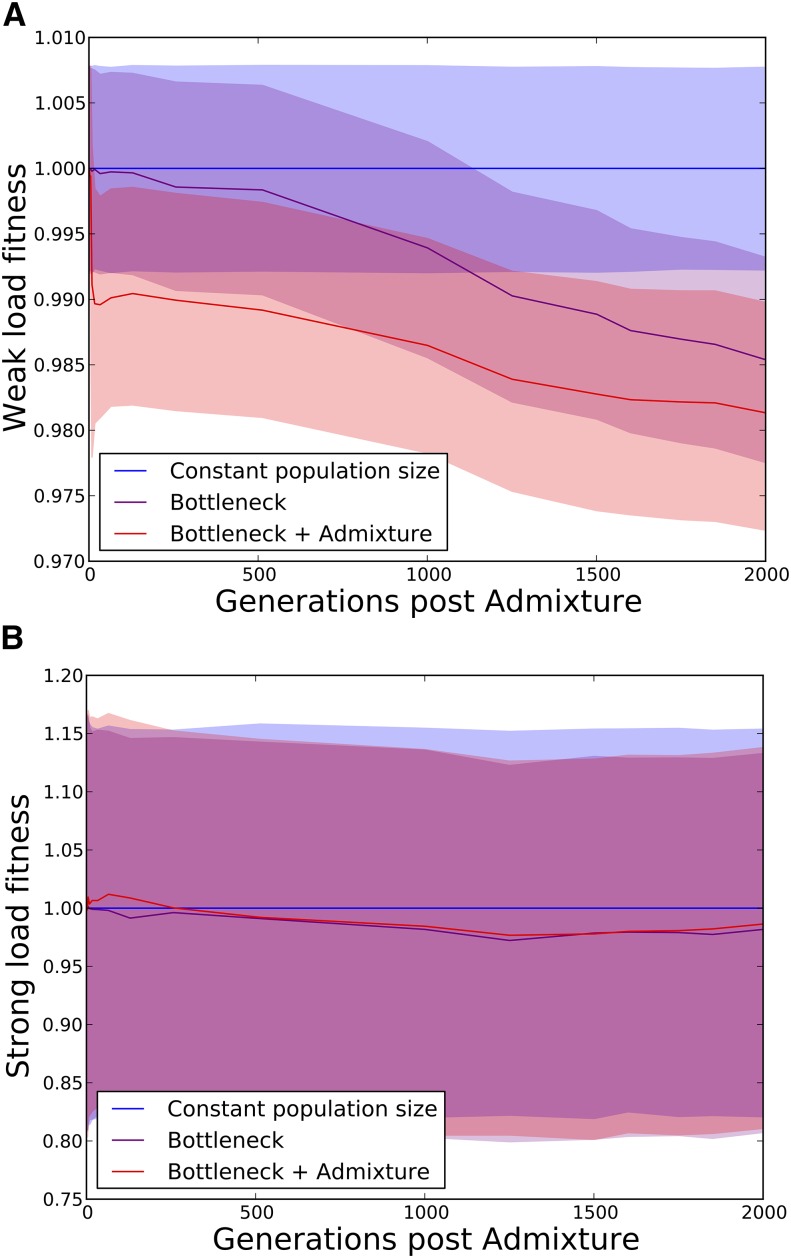
Figure 6.
(A and B) Plots showing the mutation load in three simulated human populations, one with constant population size, one that experiences only the out-of-Africa bottleneck, and a third that experiences the bottleneck along with Neanderthal admixture (see Figure 2), assuming additive fitness effects. We partition each individual’s mutation load into two components: the weak load due to mutations with selection coefficient <0.0005 and the strong load due to mutations with selection coefficient >0.0005 (note the difference in scale between the two y-axes). At time t, each individual’s weak-load fitness and strong-load fitness are normalized relative to that of the median individual in the constant-size population. The solid lines show the median in each respective population, and the colored areas encompass the 25th–75th percentiles. A shows that the admixed population suffers the greatest fitness reduction due to weak mutations, even 2000 generations after admixture. B shows that neither the bottleneck nor admixture affects the strong load.

