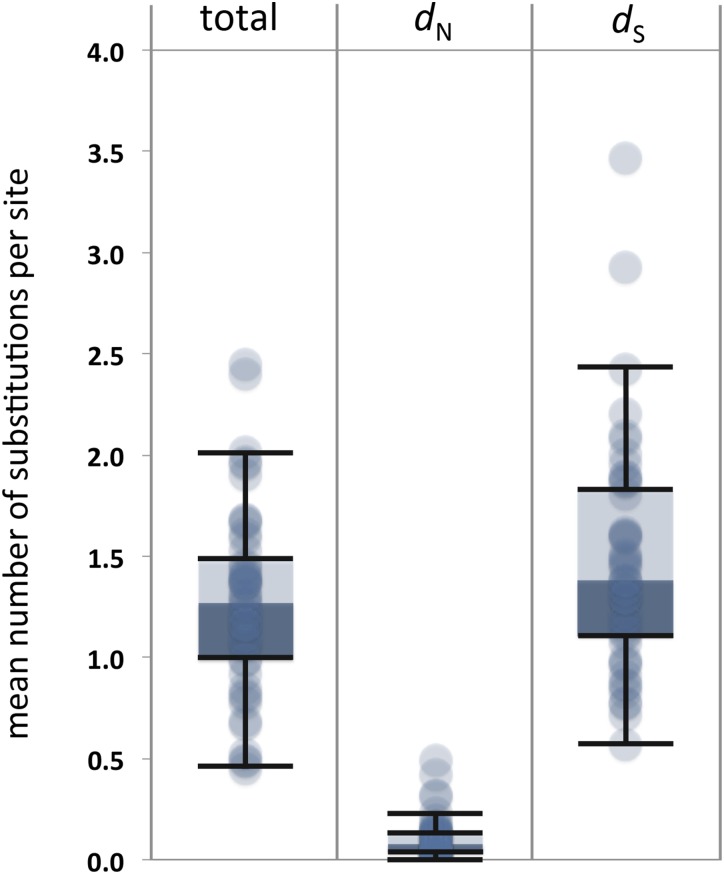
Figure 2.
Distribution of maximum likelihood estimates of total tree length (t), the nonsynonymous rate (dN), and the synonymous rate (dS) among the 48 NR gene sequences. Sequence divergence statistics are derived from maximum likelihood estimates of parameter values under codon model M0. The scale for the total tree length is the number of substitutions per codon site, which consists of three nucleotides. The scale for both the nonsynonymous and synonymous rates is the number of substitutions per single nucleotide site of the relevant type. The distributions are summarized as box and whisker plots. Data points outside the top and bottom fences are interpreted as outliers.

