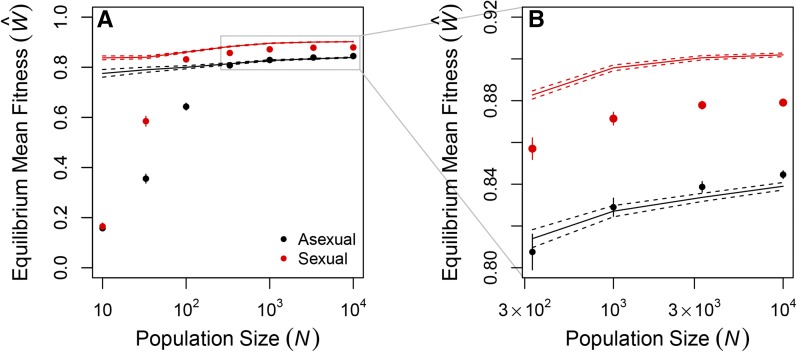
Figure 2.
Equilibrium mean fitness shows the effects of Muller’s ratchet, mutation load, and recombination load. The equilibrium mean fitness of large populations differed only slightly from the expectation at mutation–selection balance (Box 1). Values are means and 95% confidence intervals of the observed fitness in asexual (black) and sexual (red) populations after generations of evolution (replotted from Figure 1B). Solid lines show the expectation under the mutation load equation in Box 1 and dashed lines show 95% confidence intervals calculated from the observed in each population. A and B show data from all populations (A) or from only the largest populations (B).

