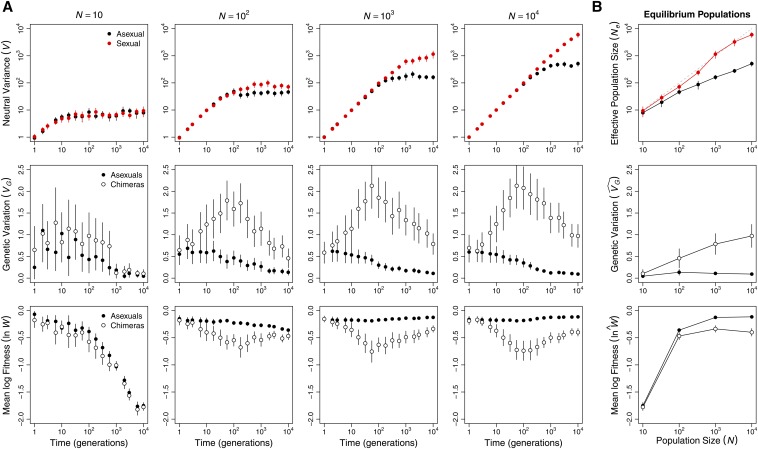
Figure 3.
Hill–Robertson interference affected asexual populations of all sizes. (A) Hill–Robertson interference depressed variance at a neutral locus in asexual (black) compared to sexual (red) populations (top row). The LD that accumulated in asexual populations also decreased genetic variance in log fitness, VG = and increased mean log fitness, Data in the middle and bottom rows compare these metrics in the real asexual populations (solid circles) and populations of chimeras with the same allele frequencies but no LD (open circles). (B) Means of each metric at generation Effective population size was estimated as (see Materials and Methods, Population metrics). Values are means and 95% confidence intervals based on 50 replicate populations initiated from different randomly chosen founders.

