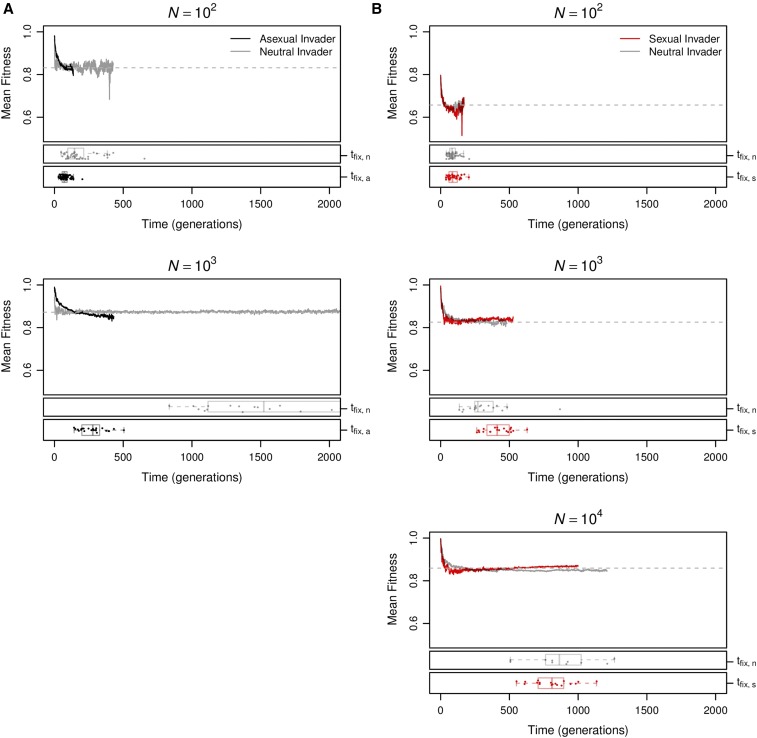
Figure 5.
Changes in the genetic architecture influence both the origin and maintenance of sex. We monitored the fixation and loss of asexual mutants introduced into equilibrium sexual populations (black lines, A), of sexual mutants introduced into equilibrium asexual populations (red lines, B), and of neutral mutants introduced into both sexual and asexual populations (solid gray lines, A and B, respectively). Lines show the evolution of mean fitness among invading mutants, averaged over at least 10 successful invasions. The equilibrium mean fitness of the populations being invaded is represented by a gray dashed line across each plot. Points and corresponding boxplots shown at the bottom of each plot indicate the time of fixation for individual neutral sexual or asexual mutations.

