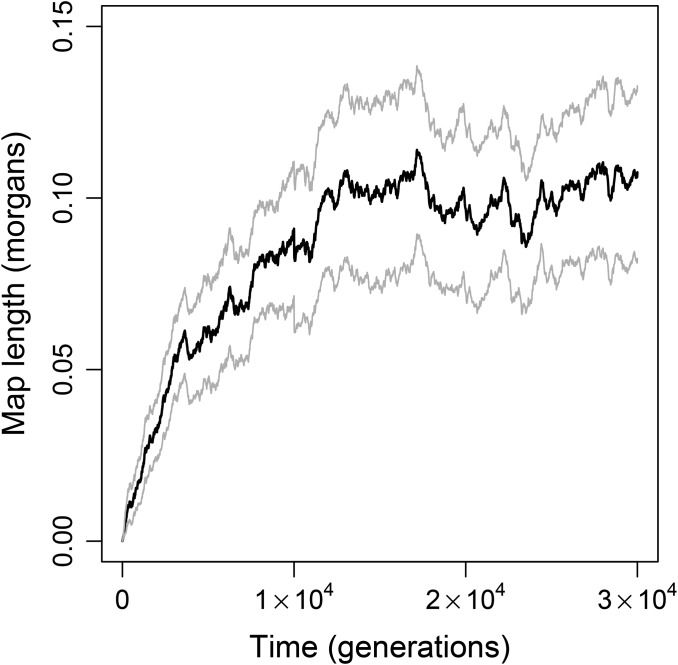
Figure 6.
Evolution of the recombination rate under recurrent mutation at the recombination modifier locus. Solid and shaded lines show the change in mean and confidence interval, respectively, of the genome map length (i.e., mean crossover probability) over time. Data are from 50 replicates initiated with the equilibrium asexual populations of size shown in Figure 1.

