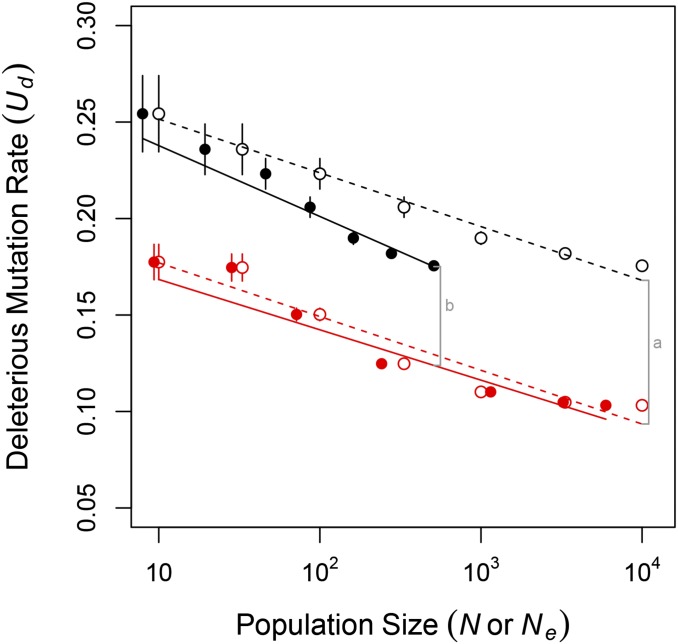
Figure 7.
Hill–Robertson interference explains part of the difference in equilibrium between sexual (red) and asexual (black) populations. Shown are equilibrium values of the genome-wide deleterious mutation rate vs. census population size N (open circles, replotted from Figure 1) and vs. effective population size (solid circles). Lines are best fit linear models obtained separately using N (dashed lines) or (solid lines) as a dependent variable together with reproductive mode. The total difference in exhibited by sexual and asexual populations of census size (gray line a) is attributable to differences in both the strength and the efficiency of selection acting on genetic architecture. The difference in exhibited by sexual and asexual populations of effective size (gray line b) is the proportion of the total difference that remained after controlling for differences in the efficiency of selection that arise through Hill–Robertson interference.

