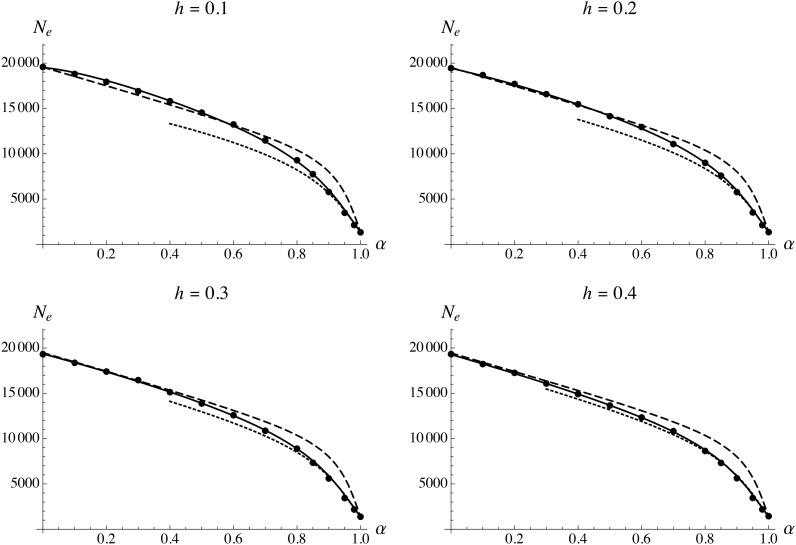
Figure 2.
Effective population size as a function of the selfing rate α, for different values of the dominance coefficient of deleterious alleles h. Solid circles show simulation results (in this and subsequent figures, error bars are smaller than the size of the solid circles), solid curves show analytical predictions from the complete model (see File S2), dashed curves show the tight linkage approximation [Equation 26, replacing h by and r by ], and dotted curves show the high selfing approximation (Equation 34). Parameter values:

