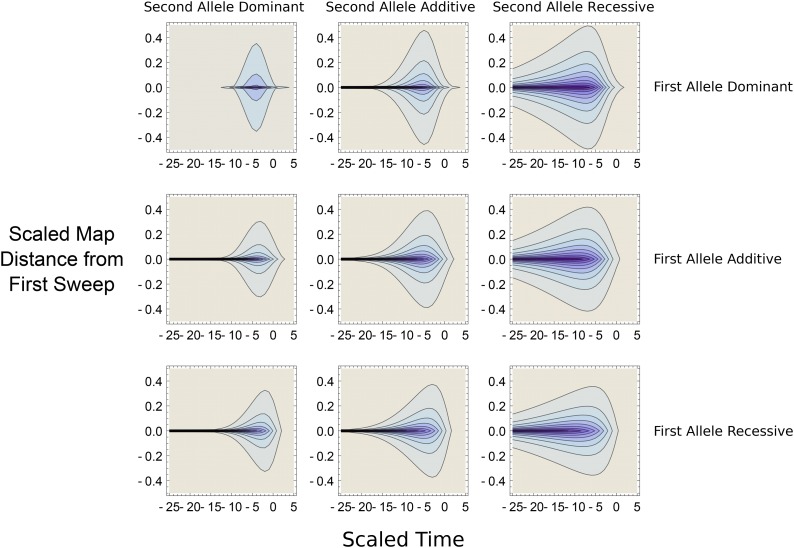
Figure 5.
Contour plots showing degree of interference, as measured by Equation 2 with Π defined by Equation 23 and (as ), for different dominance values. In all panels, darker colors indicate higher degree of interference (R approaching 0); x-axis denotes time of the sweep (with the sweep reaching 50% frequency at ); y-axis is the map distance from the first sweep (scaled to ). Labels denote the dominance value of the first and the second mutation, with recessive mutants having additive mutations dominant mutations Other parameters are and so

