Figure 2.
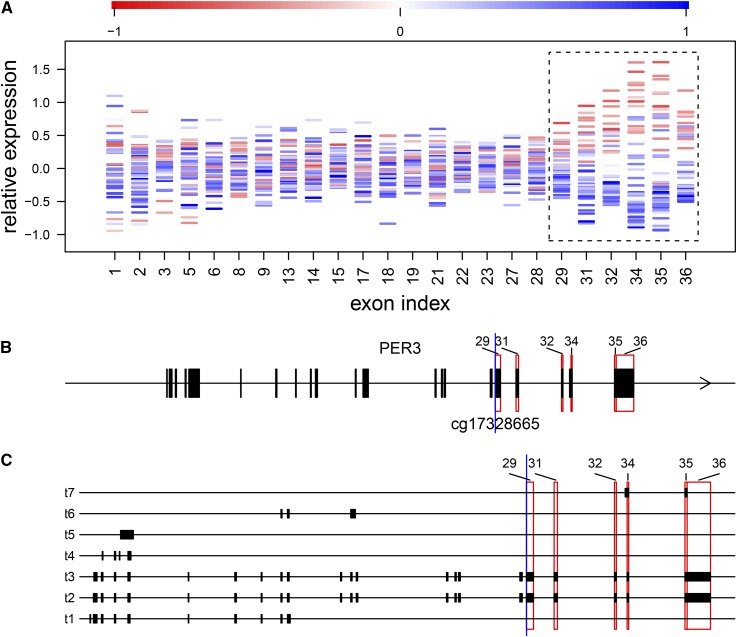
An example of cytosine modification-specific TIV, showing cytosine modification levels at cg17328665 associated with TIV of the PER3 gene. (A) For each of the analyzed exons indexed based on the flattened gene model (x-axis), the mean-subtracted expression levels are plotted for individual CEU samples (y-axis) and colored according to the relative cytosine modification levels at cg17328665. Highlighted are exons indexed 29, 31, 32, and 34–36 (blocked by the dashed line), whose expression levels increase with decreasing cytosine modification levels, suggesting that cytosine modification at cg17328665 suppresses the inclusion of these exons. Exons indexed 32 and 34–36 were called significant at the 5% FDR threshold. The discontinuity of exon indexes along the x-axis was due to exons interrogated by fewer than two probes and excluded from analysis. (B and C) The relative positions of cg17328665 (blue vertical line) and the highlighted exons (red rectangles) are marked in (B) the flattened gene model and (C) the transcripts annotated by Gencode release 19, shown as transcripts 1–7 (t1–t7) for simplicity.

