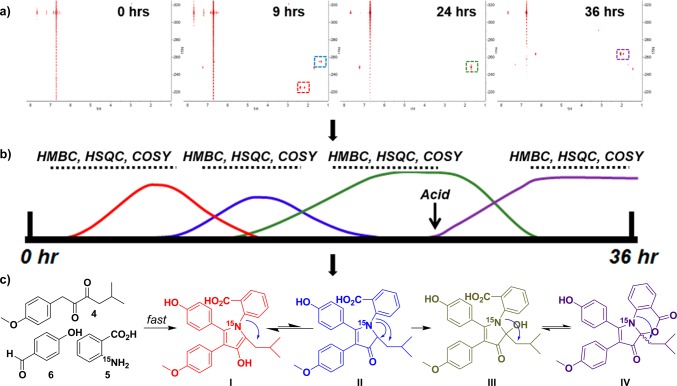
Figure 3.
Reaction time course monitored by 1H–15N NMR spectroscopy. (a) Representative time points from 1H–15N HMBC experiments. Major correlations are highlighted using colored boxes on the spectra. (b) Construction of a reaction timeline on the basis of 1H–15N HMBC experiments allows the design of additional NMR experiments to elucidate the structures of intermediates. (c) Structures of intermediates determined through the use of one- and two-dimensional NMR data.

