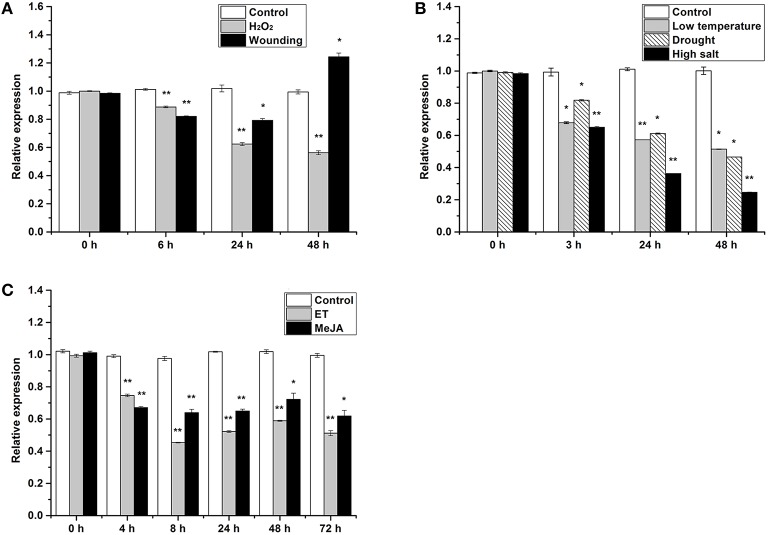
Figure 2.
Real time RT-PCR analyses of HbTCTP expression patterns under different treatments. Panels (A–C) represent real time RT-PCR analyses of HbTCTP expression profiles under H2O2 and wounding; low temperature, drought, and high salt; ET and MeJA treatments, respectively; 18S rRNA is used as the internal control for real time RT-PCR analyses. The standard bars were obtained from at least three independent replications (different RNA preparations from different biological replicates) and the results were given as mean ± S.D. Compared with the control, one asterisk shows significant difference with a P < 0.05, and two asterisks show very significant difference with a P < 0.01.

