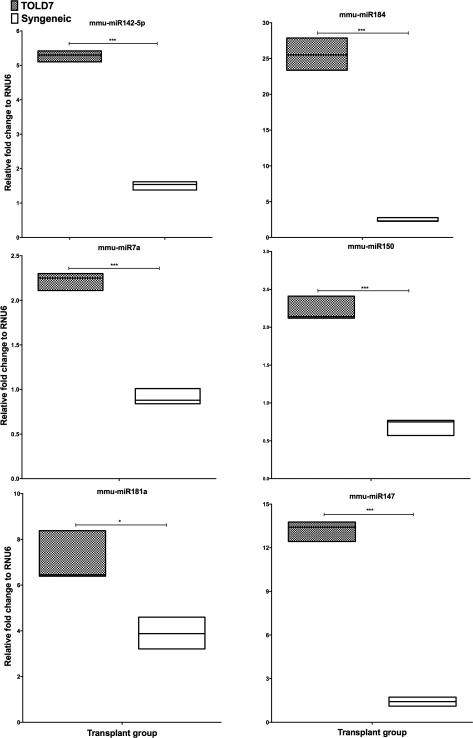
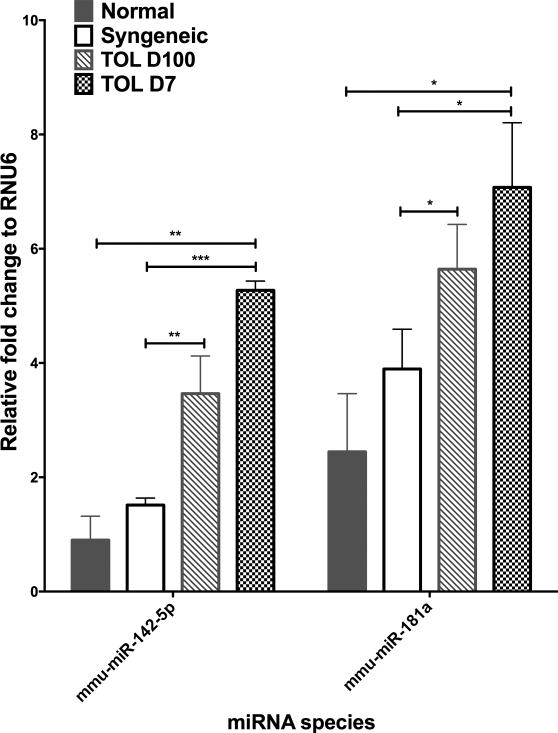
Figure 3. Intragraft miRNA are increased in tolerance.
(A) Shown are six miRNA that were significantly and specifically differentially increased in TOL D7 as compared to SYN, livers at D7 post-transplant. (B) Relative fold changes of mmu-miR142-5p, mmu-miR181 in the normal, SYN, TOL D100 and TOL D7 livers. *P≤0.05, ** P≤0.01, ***P≤0.001 via unpaired T-test, adjusted for FDR 10%.


