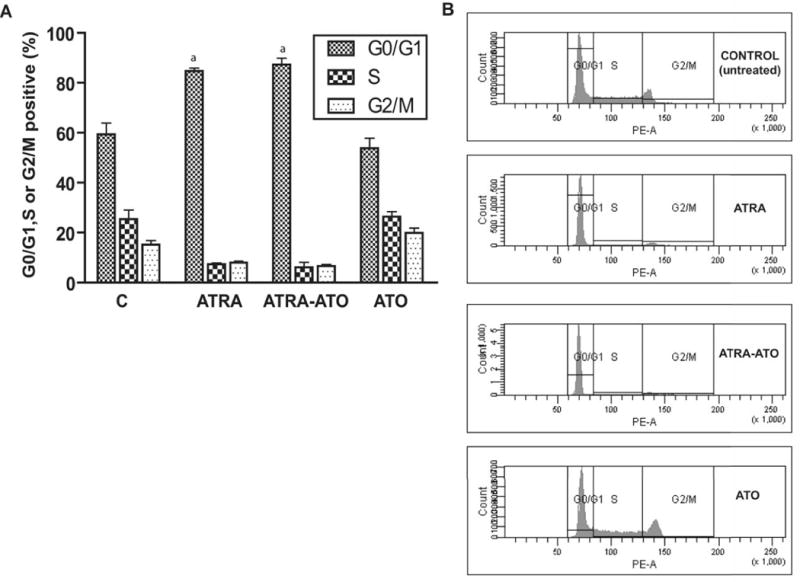
Figure 8.

(A) Arsenic Trioxide did not accelerate ATRA induced G0 arrest. The percentage of G1/G0, S and G2/M cells at 72 h after the treatment is shown for control (untreated), ATRA, ATRA-ATO combination treated and ATO alone treated cells. Y-axis here shows the percentage of cells in the different cell-cycle phases at 72h. The X-axis shows the different treatment groups. Cells stained with hypotonic Propidium Iodide (PI) solution were incubated for 1h and analyzed by flow cytometry. Similar DNA histograms were prepared for earlier time points also and we did not see a significant difference in the percentage of cells arrested in G1/G0 arrest between the ATRA-ATO case and ATRA alone case. (B) Representative DNA histograms for G1/G0 arrest in the untreated (control) cells, cells treated with ATRA, cells treated with ATRA-ATO combination and cells treated ATO alone are shown at 72 h.
