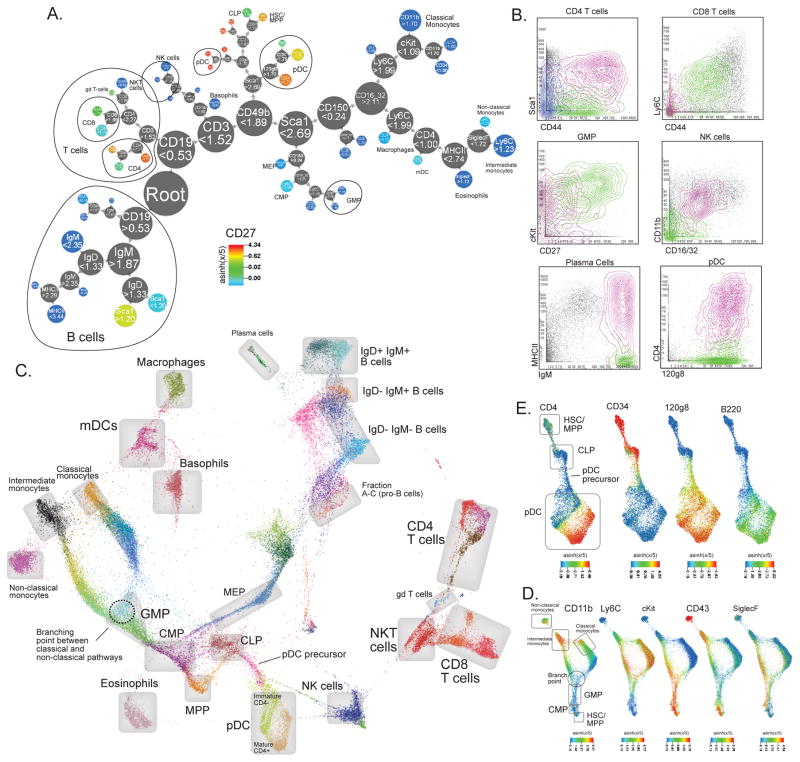
Figure 2. X-shift clustering reveals novel features of mouse hematopoietic differentiation.
(a) Clustering of bone marrow replicate #7 with X-shift (K = 20 was auto-selected by the switch-point-finding algorithm) represented in a Divisive Marker Tree. Node radii are proportional to the cubic root of the number of cell events contained at each node. The tree is a nested representation, i.e. parent nodes contain the union of cell events of its children. Labels on nodes show marker cutoff values that define each sub-branch, expressed on the arsinh(x/5) scale. (b) X-shift finds biologically relevant subsets within the hand-gated cell populations (Bone marrow replicate #7, X-shift K = 20). (c) Single-cell Force-Directed Layout of Mouse Bone Marrow #7 (X-shift K = 20, color-coded for 48 clusters). Color code shows X-shift clusters and grey boxes show locations of hand-gated cell populations. (d) Force-directed layout of populations related to monocyte development. Color code represents expression levels of indicated markers. (e) Force-directed layout of populations related to pDC development. Color code represents expression levels of indicated markers.

