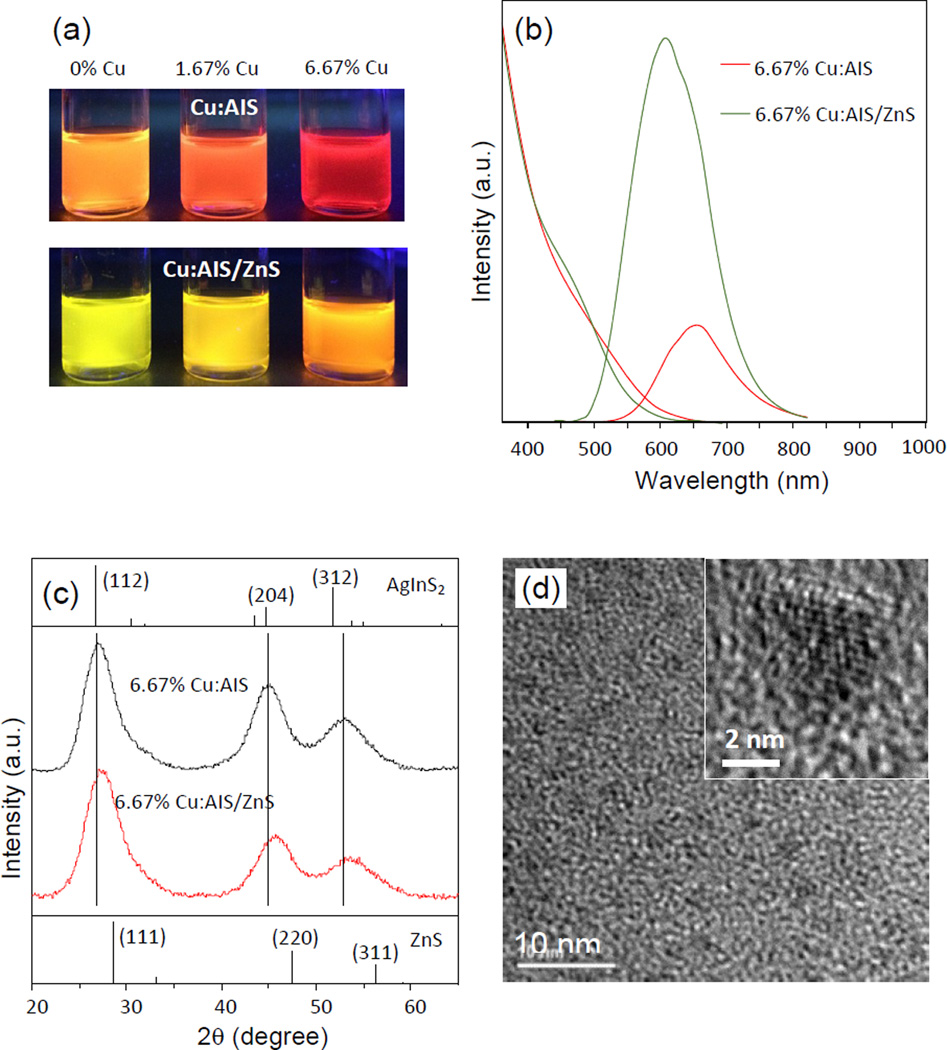
Figure 3.
(a) Digital photographs of Cu:AIS and Cu:AIS/ZnS NCs suspended in organic solvents under a UV lamp, (b) PL and absorption spectra of 6.67 % Cu:AIS and Cu:AIS/ZnS NCs. All PL spectra of NCs are scaled by their quantum yields, (c) XRD patterns of 6.67 % Cu:AIS and Cu:AIS/ZnS NCs. Diffraction peaks of tetragonal AgInS2 and ZnS, as obtained from JCPDS #25-1330 and JCPDS #05-0566, are shown as references, and (d) TEM and high resolution TEM images of 6.67 % Cu:AIS/ZnS NCs.

