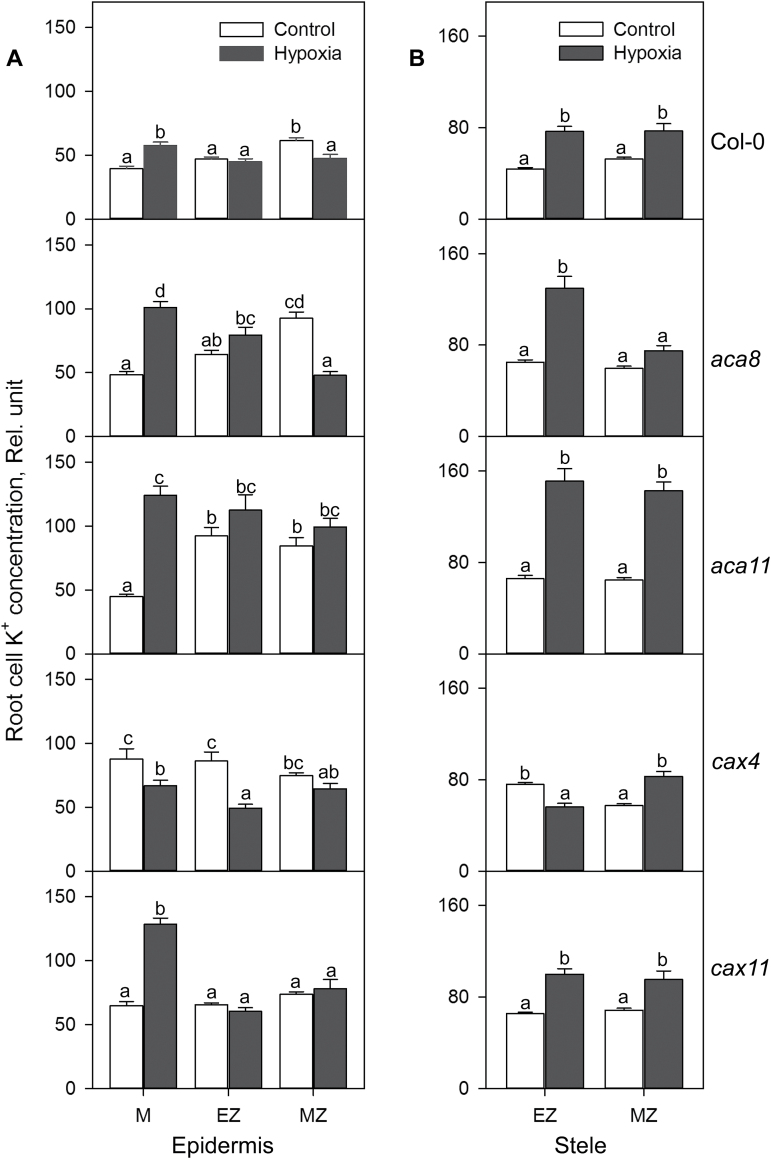
Fig. 3.
K+ concentrations in the meristem, elongation, and mature zone in root epidermis (A) and stele (B) of Col-0, aca8, aca11, cax4, and cax11 under normoxic or hypoxic treatments for 24h. The relative K+ concentration was calculated by the fluorescence integrated density using Image J software. Data are the mean ±SE (n=30–40 cells from one individual plant with at least nine replicate plants). Different lower case letters indicate significant differences at P<0.05.

