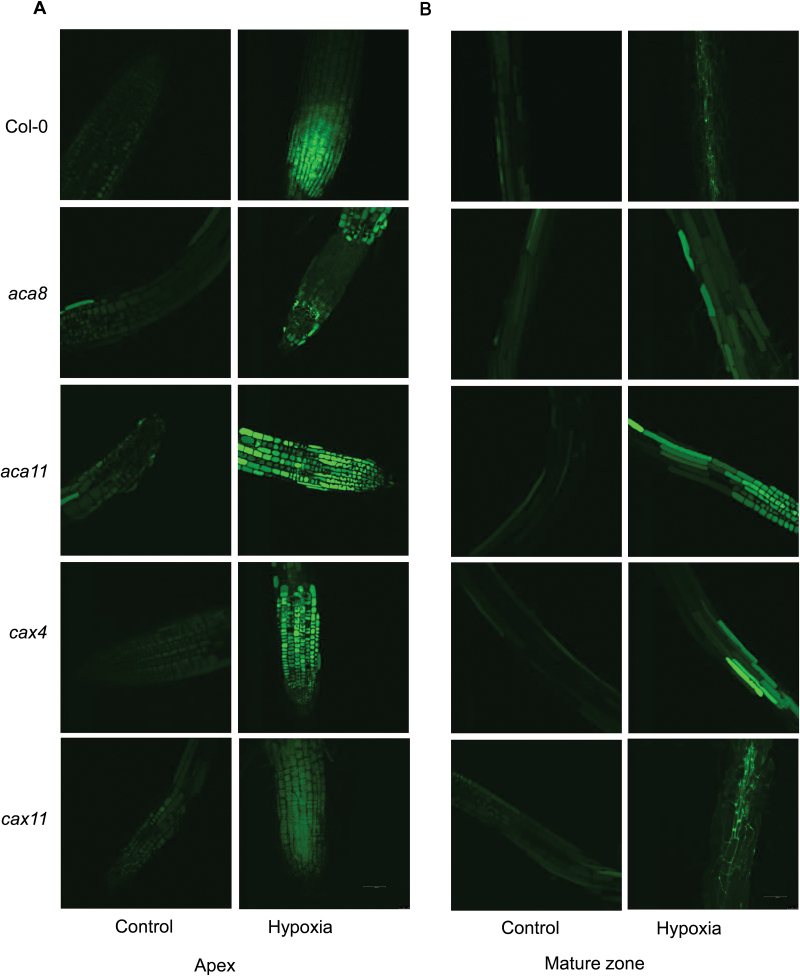
Fig. 6.
Distribution of Na+ in the root meristem, elongation, and mature zone in Arabidopsis wild type (Col-0), aca8, aca11, cax4, and cax11 under normoxic or hypoxic treatments for 24h. (A) Representative images of the root apex in control and hypoxic treatment. (B) Representative images of the root mature zone in control and hypoxic treatment. The relative Na+ concentration in roots of 10-day-old seedlings was visualized using a confocal imaging system with CoroNa Green fluorescent dye. One out of nine typical images is shown for each line. Scale bar=50 µm.

