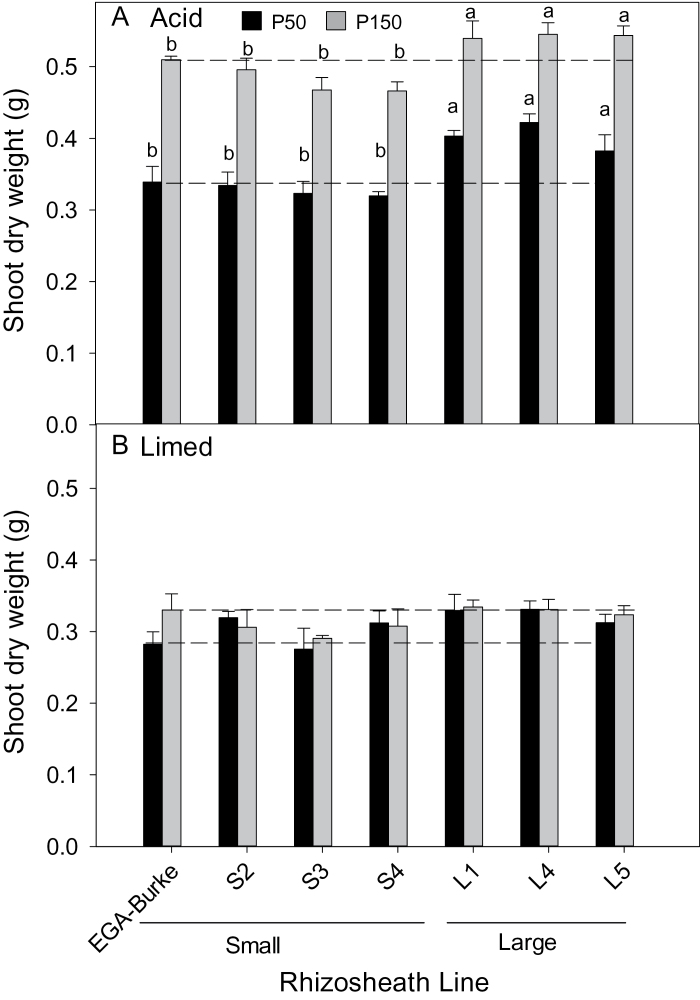
Fig. 3.
Shoot biomass of EGA Burke and BC3 NILS with large (L1, L4, L5) or small (S2, S3, S4) rhizosheaths grown in (A) non-limed (pH 4.0) or (B) limed (pH 5.5) kandosol with 50mg kg−1 or 150mg kg−1 added P. Values are means (n=4) and different letters indicate significant differences (P<0.05) between genotypes (no interaction between genotypes and treatments). For reference, the dashed lines show shoot dry weights of EGA Burke at low (lower lines) and high (upper lines) P treatments.

