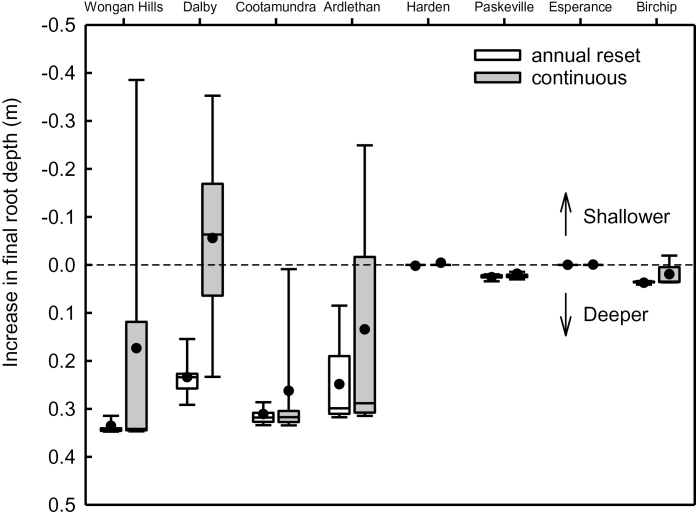
Fig. 3.
Box plots of simulated change in final root depth of modified root systems relative to the standard cultivar at eight sites varying in climate and soil type. Simulations were either reset annually (white) or run continuously. Median (solid line), mean (circle), 25th and 75th percentile (box), 10th and 90th percentile (whisker) are presented for 100 years of simulation.

