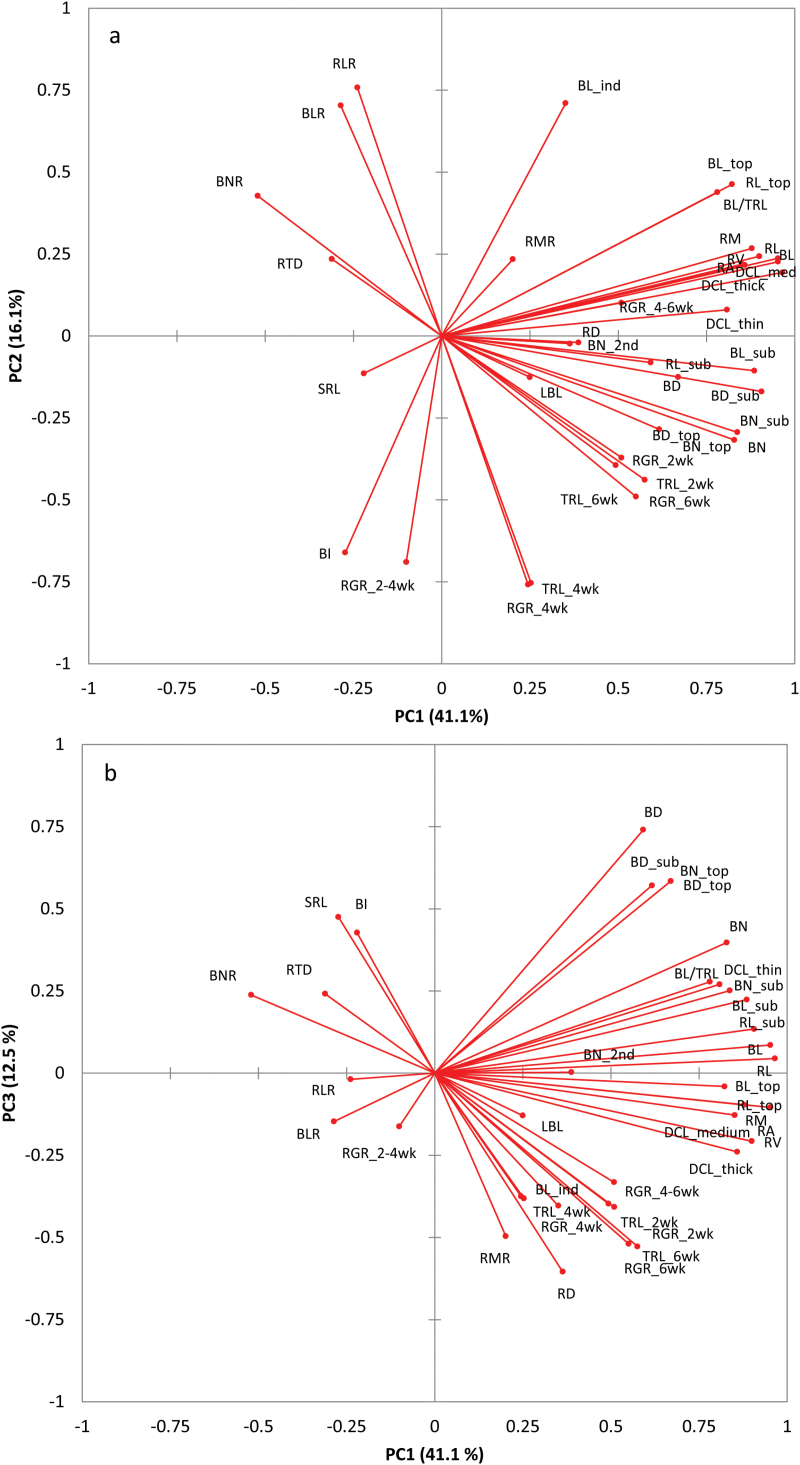
Fig. 1.
Two-dimensional plot showing the variability of 38 root traits across 111 genotypes of L. angustifolius based on PCA. Components PC1 versus PC2 (a) and PC1 versus PC3 (b) represent 57.2% and 53.6% of the variability, respectively. For root trait notations see Table 1. This figure is available in colour at JXB online.

