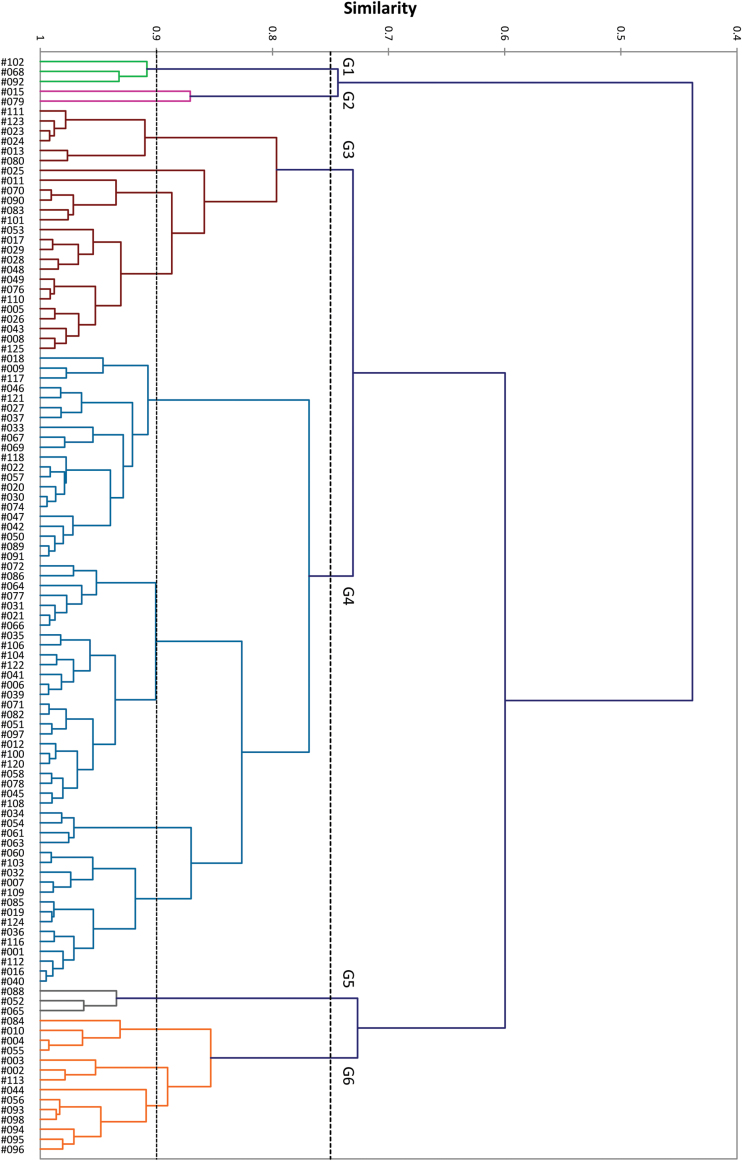
Fig. 2.
Dendrogram of AHC using the Pearson correlation coefficient on 38 root traits in XLSTAT (v2013.1). The 111 genotypes were assigned into one of six general groups (G1 to G6) at 0.75 similarity level (upper dashed line) containing 16 subgroups at 0.9 similarity level (lower dashed line). For more details on genotypes see Supplementary Table S1. This figure is available in colour at JXB online.

