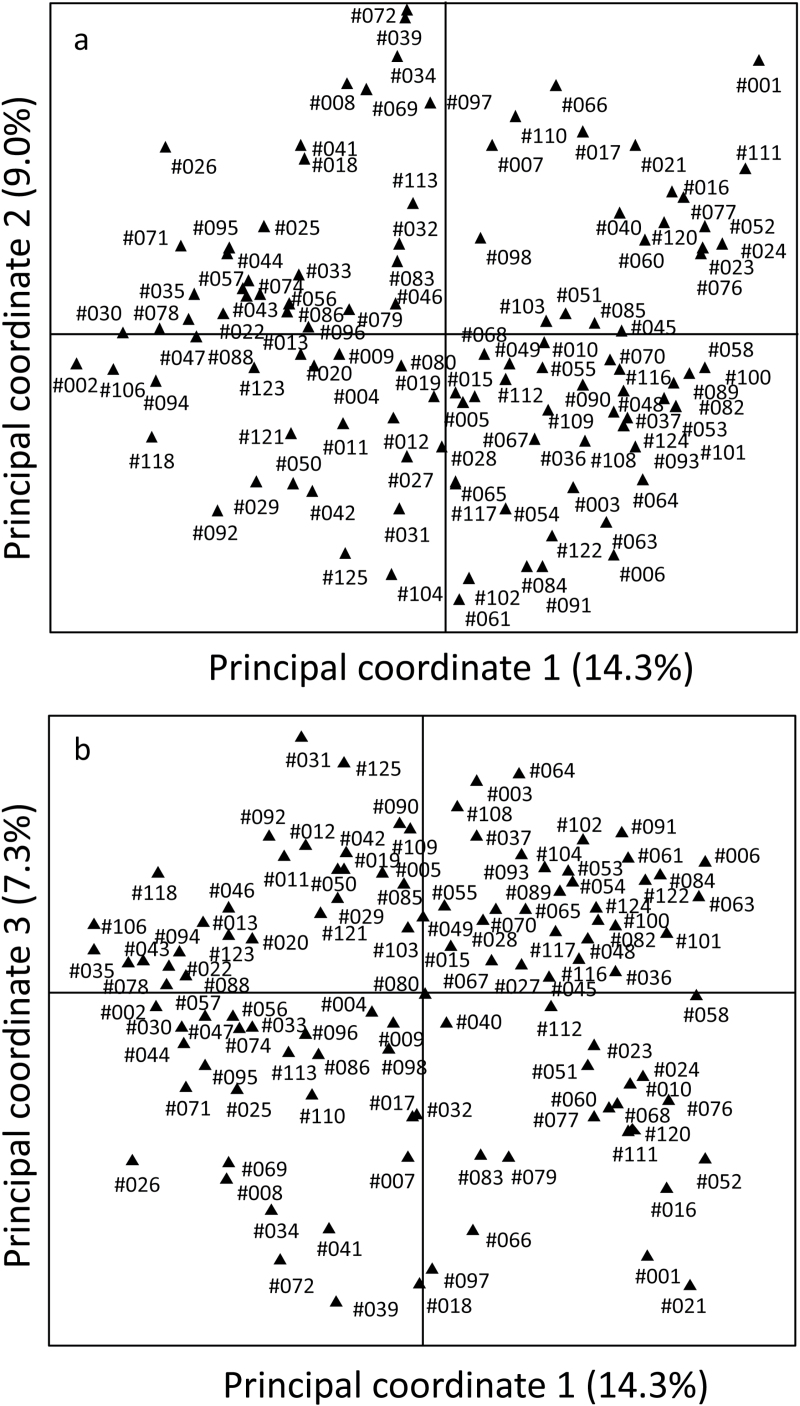
Fig. 3.
PCoA of 111 L. angustifolius genotypes based on 191 DArT markers. The graphs show the position of each accession in the space spanned by coordinate 1 versus coordinate 2 (a), and coordinate 1 versus coordinate 3 (b) of a relative Jaccard similarity matrix with FAMD. For root trait notations see Table 1.

