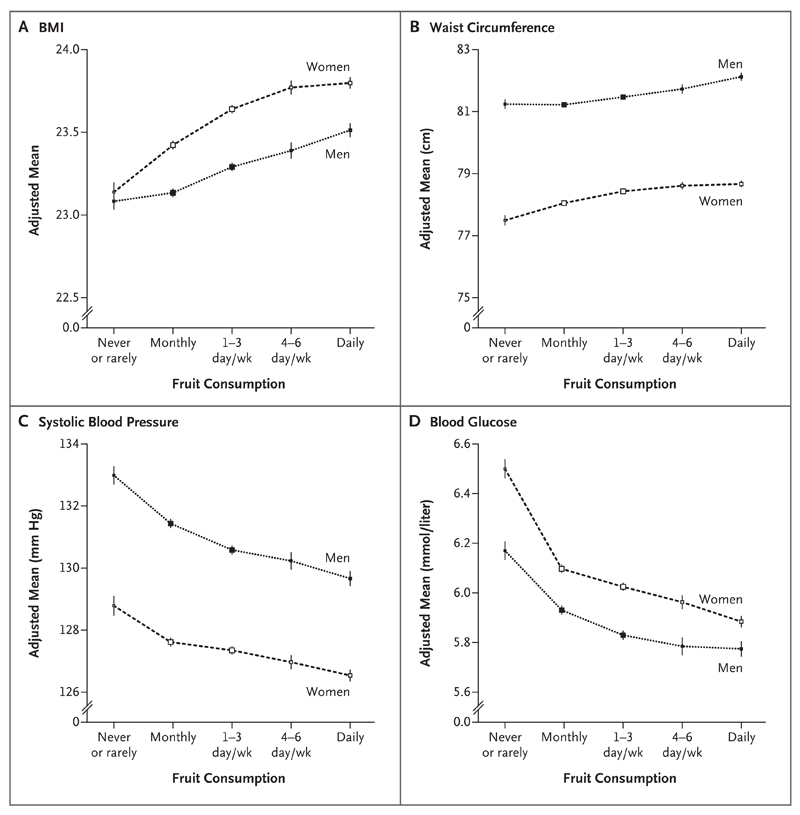
Figure 1. Adjusted Mean Body-Mass Index (BMI), Waist Circumference, Blood Pressure, and Blood Glucose According to the Frequency of Fresh Fruit Consumption.
Mean values for BMI (Panel A) and waist circumference (Panel B) were adjusted for age (10 categories), area of China (10 regions), educational level (4 categories), annual household income (4 categories), smoking status (4 categories, with the category of “Never” subdivided into “Never” and “Occasional”), alcohol intake (4 categories, with the category of “Never” subdivided into “Never” and “Occasional”), physical activity (continuous variable), survey season (4 categories), and consumption of meat (3 categories), dairy products (3 categories), and preserved vegetables (5 categories). Mean values for systolic blood pressure (Panel C) and random blood glucose measurements (Panel D) were adjusted for the listed variables plus BMI and waist circumference. Blood glucose values were missing for 7503 study participants. To convert the values for glucose to milligrams per deciliter, divide by 0.05551. Vertical lines indicate 95% confidence intervals. P<0.001 for trend, for all comparisons.

