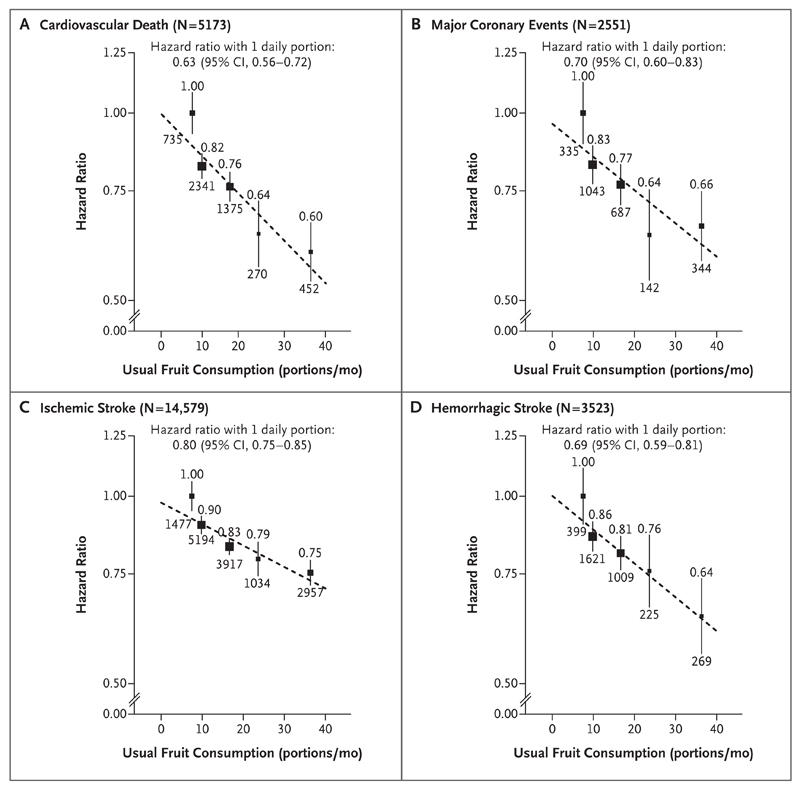
Figure 2. Adjusted Hazard Ratios for Major Cardiovascular Events According to the Level of Fresh Fruit Consumption.
Analyses were adjusted for educational level, income, alcohol intake, smoking status, physical activity, survey season, and consumption of dairy products, meat, and preserved vegetables and were stratified according to age at risk, sex, and region. The black boxes represent hazard ratios, with the size inversely proportional to the variance of the logarithm of the hazard ratio, and the vertical lines represent 95% confidence intervals. The numbers above the vertical lines are point estimates for hazard ratios, and the numbers below the lines are numbers of events.

