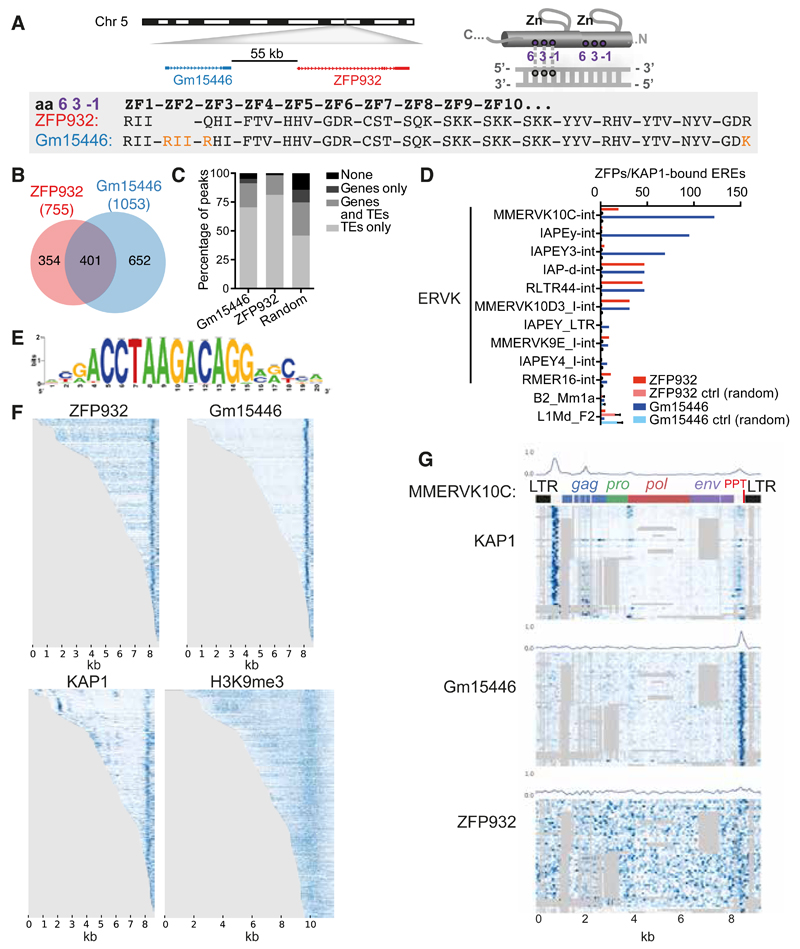
Figure 3. ZFP932 and its paralog Gm15446 bind with KAP1 to the 3’ end of distinct subsets of ERVK.
(A) Representation of genomic location of Zfp932 and Gm15446 (left), and scheme of the 3 amino acids important for DNA recognition on a zinc finger domain (right). Lower panel depicts the comparison of the 3 amino acids predicted to contact DNA of each zinc finger of ZFP932 and Gm15446, highlighting differences in orange. (B) Venn diagram of ZFP932 and Gm15446 binding sites determined by ChIP-seq in mESC. (C) Percentage of ZFP932, Gm15446, or random control peaks on genic and repeated regions. Random control is based on the mean of 100 random shuffling of the peaks of Gm15446 (KRAB-ZFP ChIP with more peaks). (D) Top 10 ERE families bound by ZFP932 or Gm15446 together with KAP1 in mESC. SINEs and LINEs (bottom) served as negative controls. A control with 100 random shuffling of the binding sites is also shown. (E) Predicted DNA-binding motif for ZFP932 and Gm15446. (F) ChIP-seq coverage plots in mESC on all EREs bound by ZFP932 or Gm15446, ranked by size. Each row is independently normalized, with enrichment proportional to darkness of the blue color. For H3K9me3, representation extends 1 kb up and downstream of the ERE boundaries. (G) Coverage plot on multiple alignment of different ChIP-seqs in ES cells on “full-length” (>5kb) MMERVK10C-int bound by ZFP932 or Gm15446. Repbase MMERVK10C-int consensus is represented on top. Mean of binding coverage is illustrated in each plot. Each row is independently normalized, with enrichment proportional to darkness of the blue color. Gray areas correspond to gaps in multiple alignments. Error bars represent SD. See also Figure S3.

