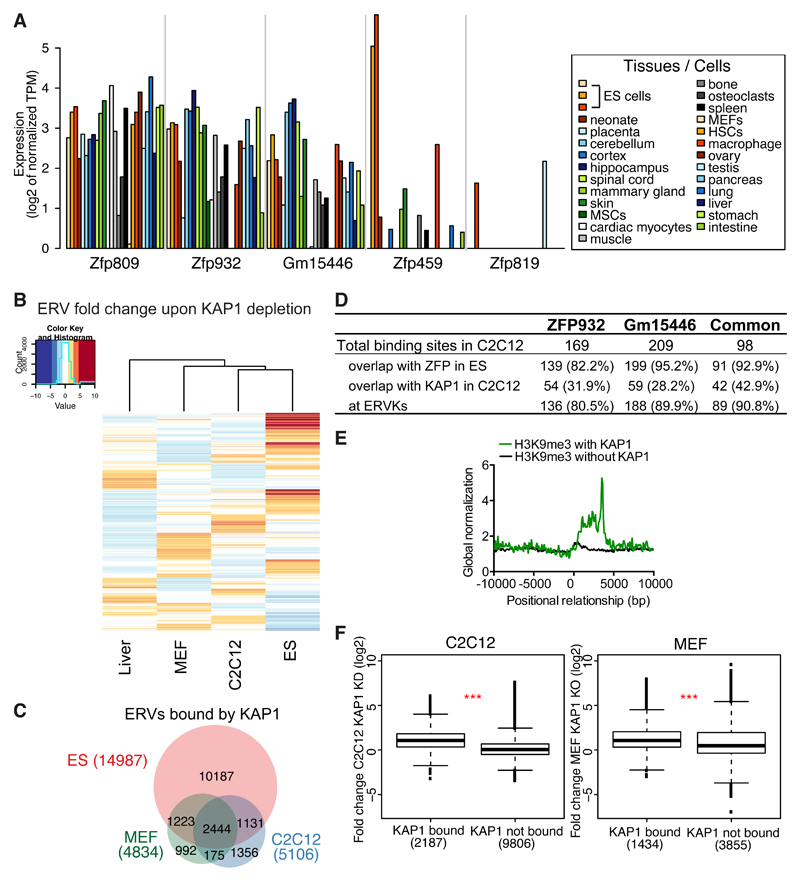
Figure 5. The KRAB/KAP1 system controls TE expression in differentiated tissues.
(A) Krab-zfp genes mRNA expression according to FANTOM 5 CAGE data. MSCs, mesenchymal stem cells; HSCs, hematopoietic stem cells. (B) Heatmap of ERVs average fold-change expression (linear scale) upon KAP1 depletion in different tissues. Liver = Kap1 KO versus control, C2C12 = Kap1 KD versus control, MEF = Kap1 KO versus control, ES = Kap1 KO versus control. (C) Venn diagram of ERVs bound by KAP1 in ES, C2C12, or MEF cells. (D) Comparative table of ZFP932, Gm15446 or common ZFP932 and Gm15446 binding sites in C2C12, determined by ChIP-seq. Absolute values and percentage relative to total binding sites are given. (E) Distribution of H3K9me3 ChIP-seq with or without presence of KAP1, in C2C12, relative to the 5’ end of ERVK elements (5’ end corresponds to 0 bp). (F) Boxplot of ERVKs fold-change expression in C2C12 Kap1 KD or MEFs Kap1 KO versus control. *** p ≤ 0.001, Wilcoxon test. See also Figure S5.

