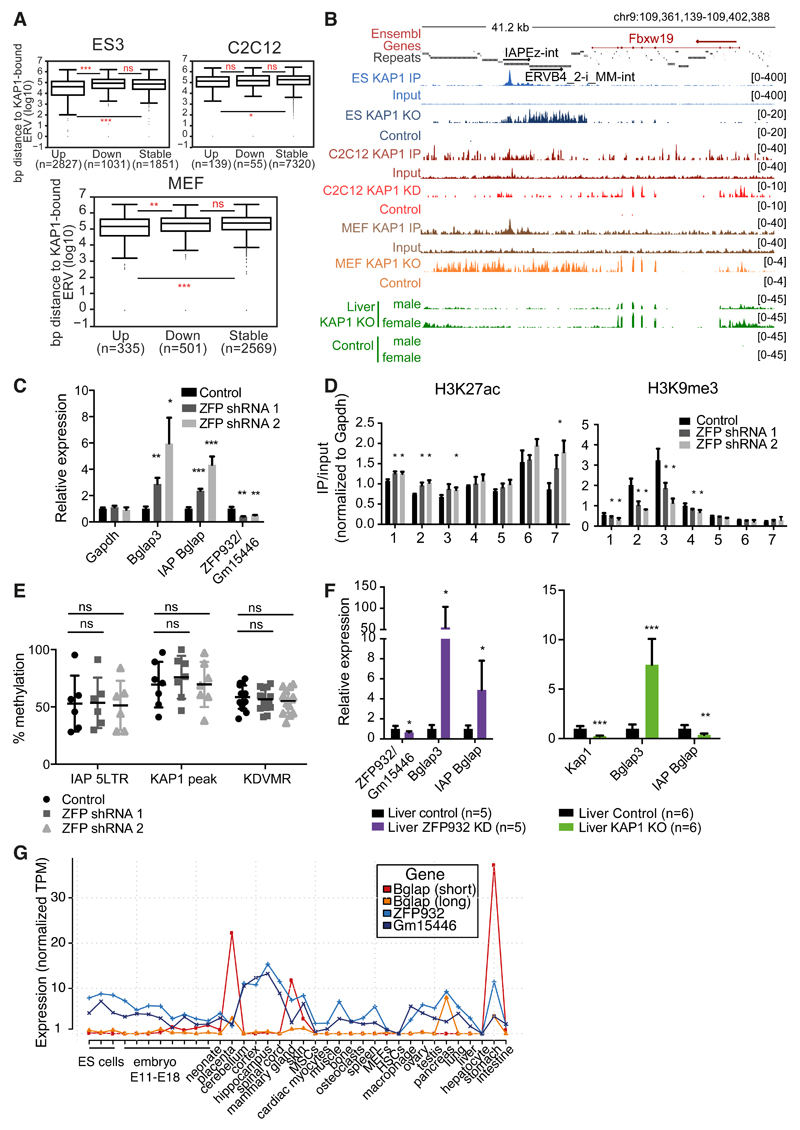
Figure 6. TEs and their KRAB/KAP1 controllers influence gene expression in adult tissues.
(A) Distance to nearest KAP1-bound ERV of upregulated (fold-change ≥ 2, P adj ≤0.05), stable, or downregulated (fold-change ≤ 2, P adj ≤ 0.05) genes in ES cells Kap1 KO, C2C12 Kap1 KD, or MEFs Kap1 KO. (B) Representative genomic region with ERV and Fbxw19 gene regulated by KAP1 in differentiated cells. KAP1-depleted and control RNA-seq densities of different tissues/cells are depicted along with KAP1 ChIP-seq data. (C) mRNA expression of Bglap3 gene and IAP Bglap in ZFP932/Gm15446 KD in C2C12 cells versus control (normalized to ActinG and Tbp). (D) ChIP-PCR of chromatin marks on Bglap3 locus in ZFP932/Gm15446 KD vs. control C2C12 cells. (E) DNA methylation analysis by pyrosequencing on IAP Bglap in same cells. (F) mRNA expression of Bglap3 gene and IAP Bglap in ZFP932/Gm15446 KD or Kap1 KO mice liver compared to control (normalized to Gapdh and ActinB). (G) Zfp932, Gm15446, and Bglap3 gene expression in different murine tissues/cells according to FANTOM 5 CAGE data. AU, arbitrary units; MSCs, mesenchymal stem cells; HSCs, hematopoietic stem cells. Error bars represent SD, * p < 0.05, ** p ≤0.01, *** p ≤ 0.001, ns= not significant, Wilcoxon test was used in panel A and Student’s t test in panels C-F. See also Figure S6.

