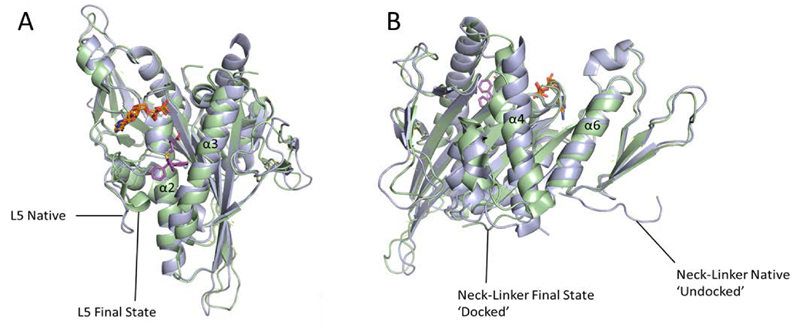
Figure 7.
The sequence of conformational changes induced upon inhibitor binding to Eg5. Overlays of native ADP-Eg5 (light blue, PDB 1II6) with the crystal structure of STLC-ADP-Eg5 in its final inhibitor bound state (pale green, PDB 2WOG). Bound ADPs (orange) and STLC (magenta) are shown in stick form. A) Loop L5 in native Eg5 swings round to close the inhibitor binding pocket, and helix α3 has shifted. B) The switch II cluster (helix α4, loop L12 and helix α5) is shifted to a ‘permissive’ conformation which has allowed the neck linker to dock onto the microtubule-binding face of Eg5.

