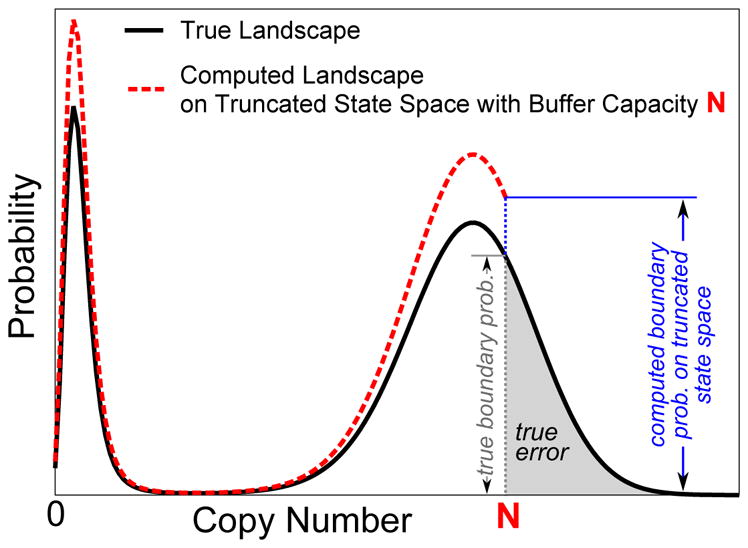
Figure 2.

An illustration for the boundary probabilities. The solid black line represents the true probability landscape on the exact state space. The dashed red line represents the probability landscape computed from the truncated state space with buffer capacity N. The gray shaded area represents the true error due to state space truncation with buffer capacity N. The probability of copy number N on the true landscape is the true boundary probability, and the probability of N on the computed landscape is the boundary probability on the truncated state space. In this study, we show that the computed boundary probability on the truncated state space can be used to bound the true error from the above.
