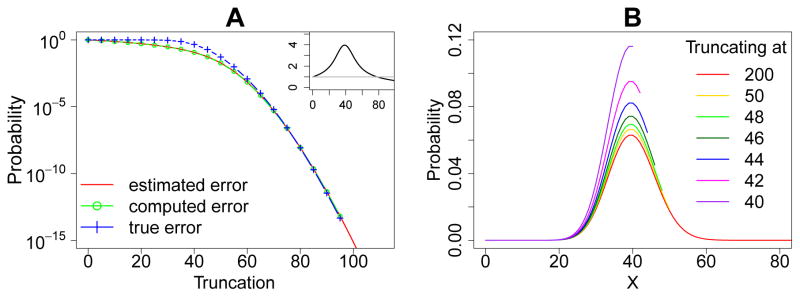
Figure 3.
Error quantification and comparisons for the birth-death model. (A): The a priori estimated error (red solid line), the computed error (green line and circles), and the true error (blue line and crosses) of the steady state probability landscape. The inset shows the ratio of the true errors to the computed errors at different sizes of the MEG, and the grey straight line marks the ratio one. The computed errors are larger than the true errors when the black line is below the grey straight line. (B): The steady state probability landscapes of X obtained with different truncations of net molecular number in the MEG. Note that probability distributions end at X where truncation occurs. The probabilities in the landscapes are inflated when truncating the state space at smaller net molecular numbers of the MEG.

