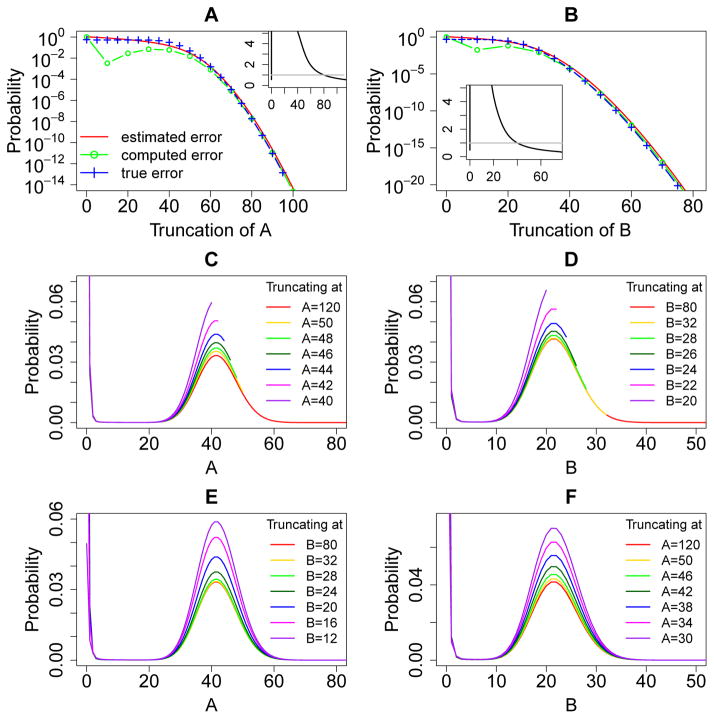
Figure 5.
Error quantification and comparisons for the genetic toggle switch model. (A) and (B): The a priori estimated error (red solid lines), the computed error (green lines and circles), and the true error (blue lines and crosses) of the steady state probability landscapes of A and B at different sizes of truncations. The insets in (A) and (B) show the ratio of the true errors to the computed errors at different sizes of the MEG, and the grey straight line marks the ratio one. The computed errors are larger than the true errors when the black line is below the grey straight line. (C) and (D): The steady state probability landscapes of A and B solved using different truncations of net molecular number in the MEG1 and MEG2, respectively. Note that probability distributions end at where truncation occurs. The probabilities in the landscapes are significantly inflated when truncating the state space at smaller net molecular numbers of the corresponding MEG. (E) and (F): The steady state probability landscapes of A and B solved using different truncations of net molecular number in the MEG2 and MEG1, respectively. The probabilities in the landscapes are also significantly inflated when truncating the state space at smaller net molecular numbers of the opposite MEG.

