
Figure 3.
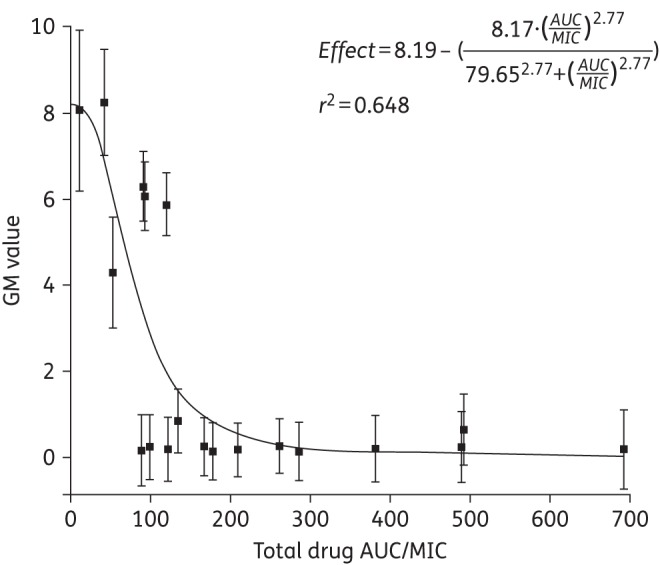
Inhibitory sigmoid Emax curve demonstrating the exposure–response relationship of isavuconazole exposure in terms of plasma AUC/MIC (x-axis) and the associated terminal GM value (y-axis). The black squares represent the observed GMI value for each rabbit (± SEM). The continuous black line represents the fit of the inhibitory sigmoid Emax model to the data.