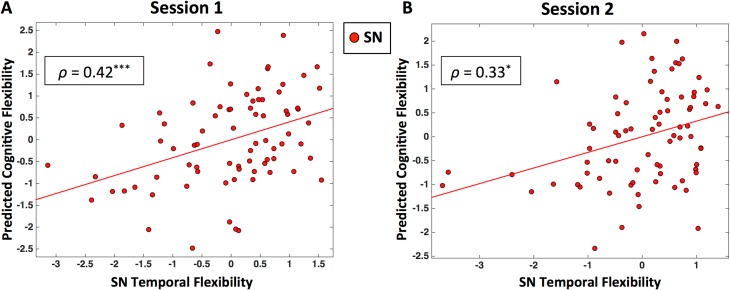
Fig 5. SN temporal flexibility predicts cognitive flexibility behavioral measures.
Panel (A) shows results from a CCA using cross-validation on Session 1 data. Scatter plot shows predictions of individual cognitive flexibility based on SN temporal flexibility. Panel (B) shows results from Session 2 data. (‘***’: p < 0.001, ‘*’: p < 0.05).

