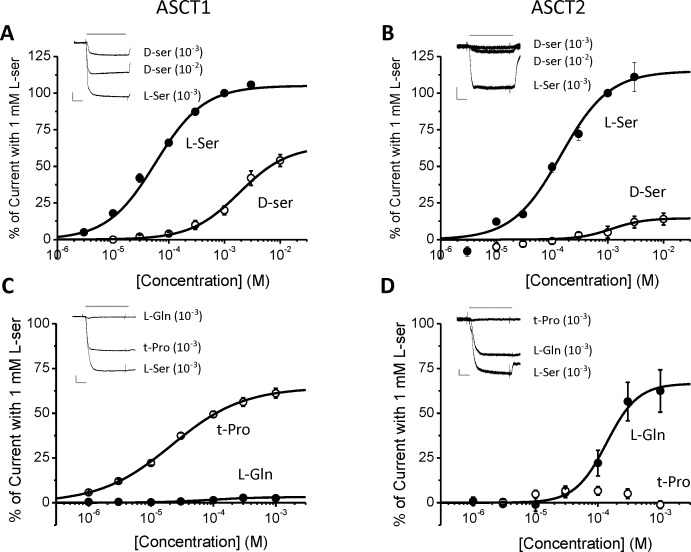
Fig 5. Responses induced by amino acids in patch-clamp recording from HEK cells expressing human ASCT1 and human ASCT2.
(A,C) Dose-response of currents activated by amino acids in HEK cells expressing human ASCT1; (B,D) Dose-response of currents activated by amino acids in HEK cells expressing human ASCT2. All currents were normalized to those evoked by 1 mM L-serine (100%). Each data points represent the mean±SEM of 4 to 7 cells. The mean EC50 values are shown in Table 6. The inserts are representative currents activated by amino acids at the concentrations shown in parentheses. Grey lines above the current traces indicate application times. The lower scale bars in grey are vertical axis: current amplitude (200 pA for A,C and 50 pA for C,D); horizontal axis: time (500 ms).

