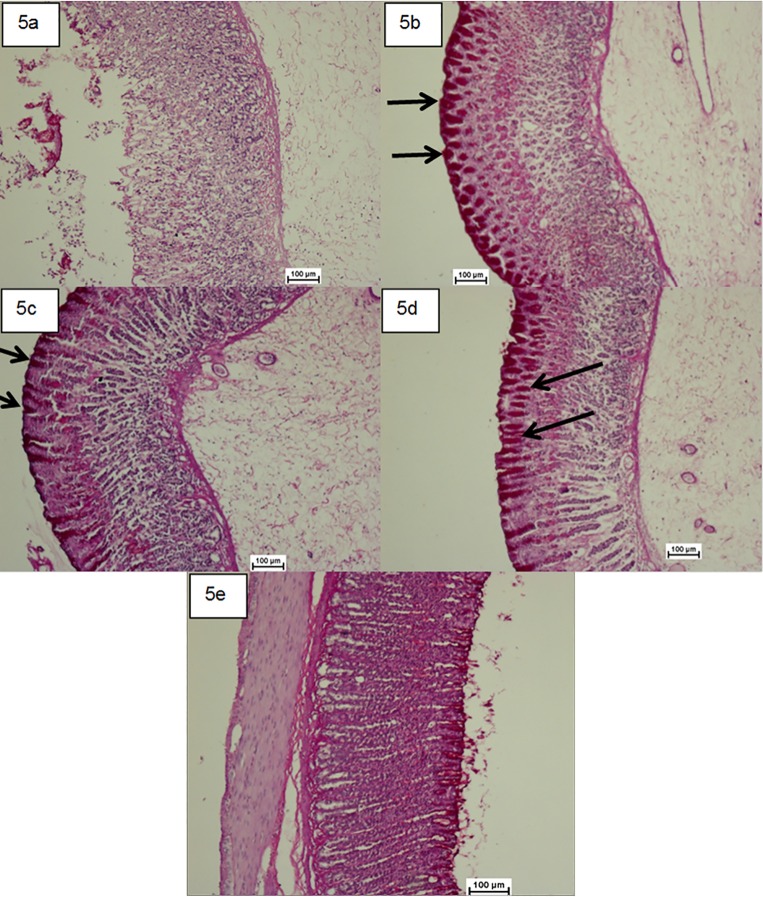
Fig 5. Photomicrographs showing the effect of the compound 1 on gastric tissue glycoprotein-PAS staining (×20).
(5a) the ulcer control group, (5b) the reference group (omeprazole, 20 mg/kg), (5c) rats received 50 mg/kg of the compound 1 (5d) rats received 100 mg/kg of the compound 1. Magenta colour in the apical epithelial cells in the treated groups with the compound shows gradual increase in mucosal secretion of gastric glands. The intense secretion of mucus in gastric glands is demonstrated in 5d. The arrow points to the glycoprotein accumulation. (5e) Rats in the normal control group showed intact gastric mucosa.

