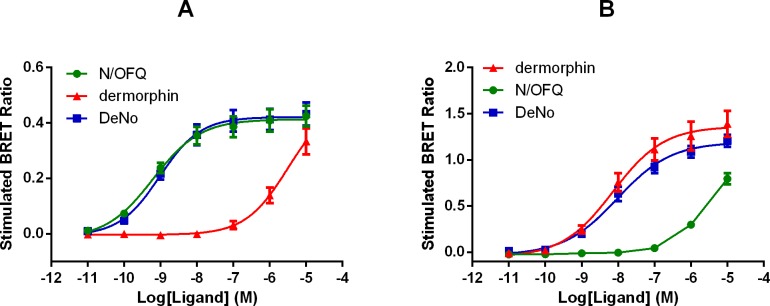
Fig 6. G-protein Recruitment Measured Using BRET.
Membrane extracts taken from HEK-293 and SH-SY5Y cells stably expressing NOP-RLuc and Mu-RLuc respectively together with Gβ1-RGFP were used. Concentration response curves to N/OFQ, dermorphin and DeNo for receptor/G protein interaction in membranes of cells expressing the NOP (A) and Mu (B) receptors. Data are the mean ± SEM of at least 3 experiments performed in duplicate.

