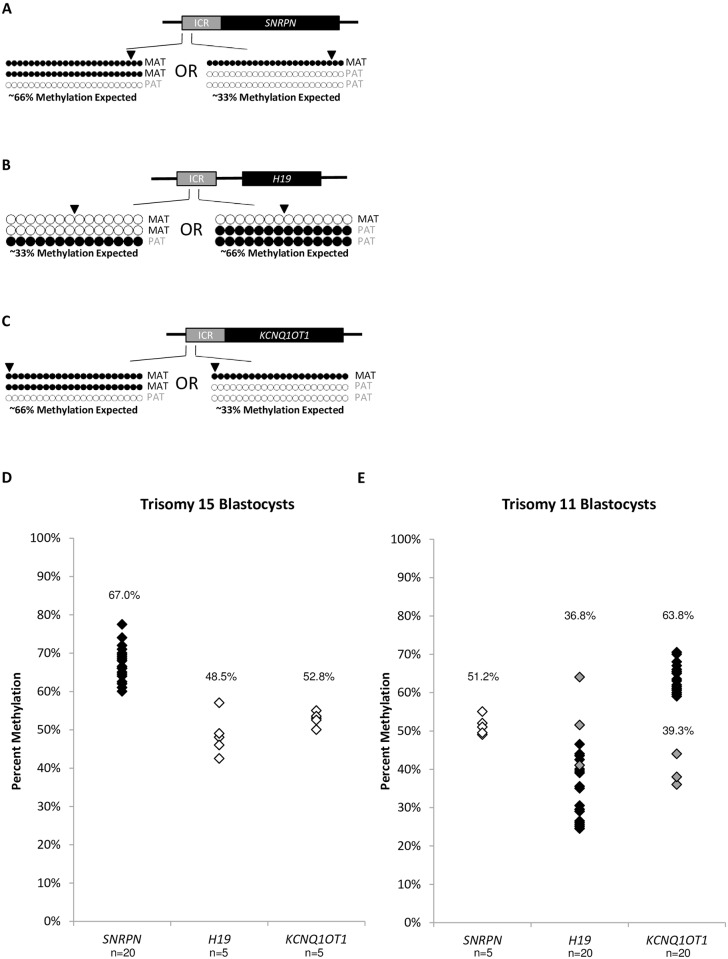
Fig 2. Imprinted DNA methylation profiles of trisomy blastocysts.
Black dots represent methylated CpGs, white dots represent unmethylated CpGs. The SNP location is indicated by an arrowhead. “MAT” represents the maternal oocyte-contributed allele; “PAT” represents the paternal sperm-contributed allele. A) Diagram of the SNRPN ICR amplified region analyzed in trisomy 15 blastocysts. Approximately 66% methylation is expected with an additional MAT allele. Approximately 33% methylation is expected with an additional PAT allele. B) Diagram of the H19 ICR amplified region analyzed in trisomy 11 blastocysts. Approximately 33% methylation is expected with an additional MAT allele. Approximately 66% methylation is expected with an additional PAT allele. C) Diagram of the KCNQ1OT1 ICR amplified region analyzed in trisomy 11 blastocysts. Approximately 66% methylation is expected with an additional MAT allele. Approximately 33% methylation is expected with an additional PAT allele. D) Summary chart of percent methylation in all trisomy 15 blastocysts at the SNRPN (n = 20), H19 (n = 5), and KCNQ1OT1 (n = 5) ICRs. Black diamonds represent blastocysts with presumable gain of the third chromosome 15 from the oocyte, grey diamonds represent blastocysts with presumable gain of the third chromosome 15 from the sperm. White diamonds represent the methylation percentage for the ICRs on diploid chromosome 11. Average percent methylation for each cohort is indicated. E) Summary chart of percent methylation in all trisomy 11 blastocysts at the SNRPN (n = 5), H19 (n = 20), and KCNQ1OT1 (n = 20) ICRs. Black diamonds represent blastocysts with presumable gain of the third chromosome 11 from the oocyte, grey diamonds represent blastocysts with presumable gain of the third chromosome 11 from the sperm. White diamonds represent the methylation percentage for the ICR on diploid chromosome 15. Average percent methylation for each cohort is indicated. Methylation dot diagrams for individual trisomy blastocysts and diploid ICRs can be found in S2 and S4 Figs, and a summary can be found in S2 Table.

