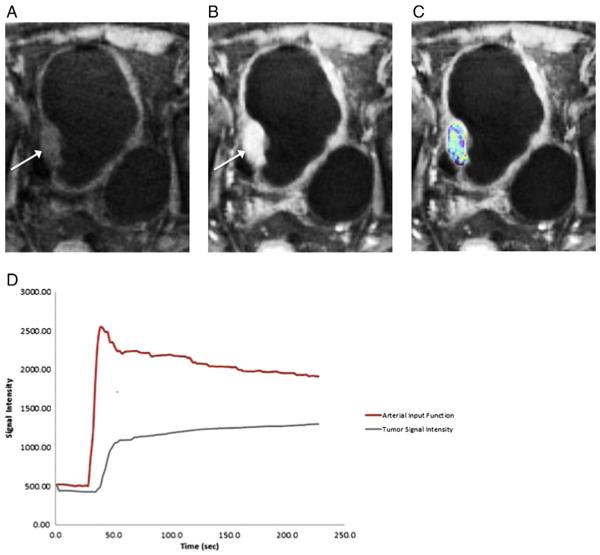
Fig. 1.
79 year old male with high-grade urothelial carcinoma of the bladder based on histologic assessment from cystoscopy. (A) Pre-contrast and (B) post-contrast images retrospectively reconstructed at 1.7-s temporal resolution from the continuously acquired radial sequence using parallel imaging and compressed sensing (GRASP) show an enhancing mass along the right lateral bladder wall (arrow). (C) A color-coded Ktrans map was generated using the high temporal-resolution data and overlaid on the post-contrast image. (D) Time–activity curves (TACs) of the individual arterial input function generated from the common femoral artery and of a region-of-interest encompassing the bladder mass used for pharmacokinetic modeling.

