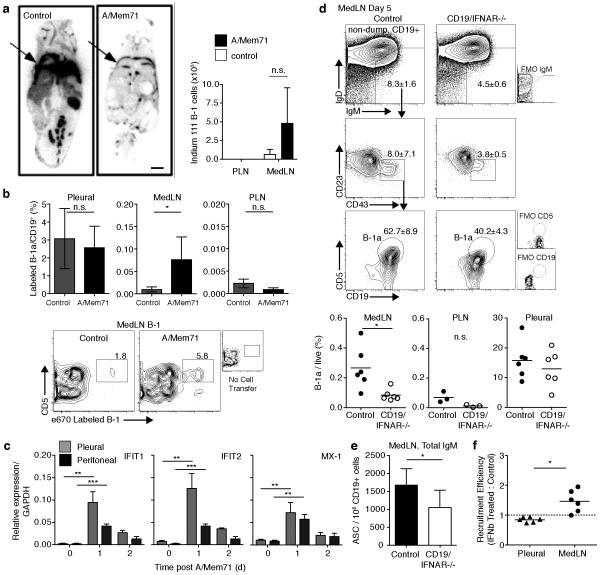
Figure 2. B-1 cell redistribution in response to infection-induced signals.
(a) Left, full-body autoradiography of mice injected intrapleurally (arrow) with Indium-111 labeled B-1 cells 3 days after A/Mem71 or mock- infection. Scale bar depicts 0.5cm. Right, gamma scintillation counts of lymph nodes converted to cell numbers using a standard curve developed from Indium-111 labeled B-1 cells. (Mean (± S. D.) (b) Top, frequency (± S. D.) of e670 labeled pleural cavity and lymph node B-1a cells in C57BL/6 mice 3 days after infection and intrapleural labeled B-1 cell transfer. Bottom, representative contour plots (n=4 mice/group) identify e670+ B-1a cells in MedLN. (c) qRT-PCR analysis of gene expression among purified cavity B-1a cells following infection. Mean (± S. D.) of 3 samples per time point, each from pooled B-1a cells (n = 12 mice). (d) Top, B-1a cell contour plot gating in MedLN from CD19/IFNAR−/− mice and litter-mate controls 5 days following infection. Bottom, day 5 tissue B-1a cell frequencies by flow cytometry. Each symbol represents one mouse, horizontal line indicates mean. (e) Mean numbers (± S. D.) IgM-secreting cells (ASC) in MedLN of CD19/IFNAR−/− mice and litter-mate controls day 5 after A/Mem71 infection. (f) Competition assay comparing tissue recruitment of autoMACs purified B-1 cells from cavities of C57BL/6 mice labeled with CFSE or e670 tracking dyes, cultured with IFNβ, washed, mixed at even proportions, and transferred to pleural cavity of n=6 C57BL/6 mice 4 days after infection. Tissue B-1a cells identified by flow cytometry 3 days after transfer (Day 7 post infection). Data presented as recruitment efficiency of labeled B-1a cells compared to controls based on tracking dye ratio normalized to input ratio. MedLN recruitment efficiency was significant compared to value of 1.0 by one sample t-test (p = 0.02). A similar experiment conducted using Ig-allotype to distinguish between groups of transferred cells showed comparable results (Supplementary Figure 2c). Student’s t-test: n.s., not significant; *p ≤ 0.05, **p ≤ 0.01, ***p ≤ 0.001, ****p ≤ 0.0001. Data represent one experiment (a, f), five experiments (b), two experiments (Ifit1 and Ifit2), one experiment (Mx-1) (c),or two pooled experiments (d, e).

