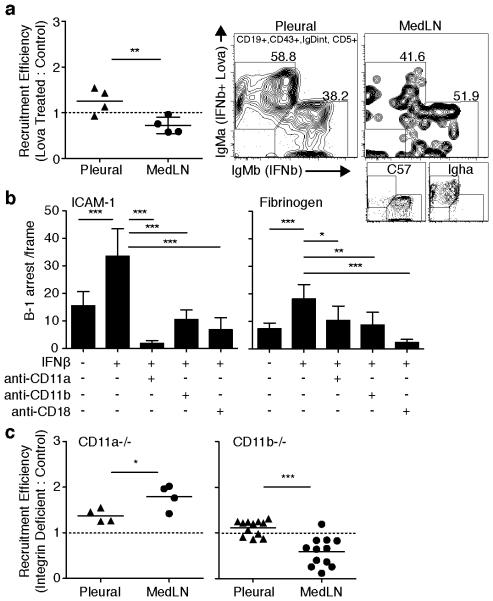
Figure 4. Type I IFN activation of CD11b alters B-1 cell adhesion.
(a) Competition assay comparing tissue recruitment of autoMACs purified B-1 cells from body cavities of allotype disparate Igha or C57BL/6 mice cultured with 200U IFNβ 16h, ± 100μM Lovastatin 10 minutes to a-allotype cells, mixed equally, and transferred into pleural cavities of μMT mice 4 days after A/Mem71 infection. Tissue B-1a cells were identified by allotype specific flow cytometry staining 3 days after transfer (Day 7 post infection). Data presented as recruitment efficiency of B-1a cells compared to control cells based on a−/b-allotype ratio normalized to input ratio. Right panel, representative flow cytometry plots showing frequency of allotype B-1 cells from competing groups in pleural cavity and MedLN at necropsy. MedLN recruitment efficiency was significant compared to value of 1.0 by one sample t-test (p = 0.05). (b) Adhesion assay showing numbers (± S. D.) of pleural cavity B-1 cell arrest following 16h stimulation with 200U IFNβ, measured on ICAM-1 (left) and fibrinogen (right) substrate with or without blocking antibodies against CD11a, CD11b, and CD18. (c) Competition assay comparing immigration of separately CFSE or e670 tracking dye labeled C57BL/6 control and (left) CD11a-deficient or (right) CD11b-deficient cavity cells mixed in even proportions and transferred into the pleural cavity of C57BL/6 mice at the time of infection with A/Mem71. Labeled B-1a cells were identified by flow cytometry staining in MedLN and blood 3 days later. Data are presented as recruitment efficiency of integrin deficient B-1a cells compared to migration by control cells based on tracking dye ratio normalized to input ratio (Supplementary Fig. 2e). MedLN recruitment efficiency was significant compared to value of 1.0 by one sample t-test (p = 0.009 (CD11a) and p = 0.0009 (CD11b)). Data represent one experiment, n = 4 mice per group (a, c (CD11a)), two separate experiments for each substrate using pooled pleural cavity B-1 cells isolated from n > 12 mice per group (b) and two pooled experiments, n = 4 or 6 mice per group (c (CD11b)). Student’s t-test: *p ≤ 0.05, **p ≤ 0.01, ***p ≤ 0.001, ****p ≤ 0.0001.

