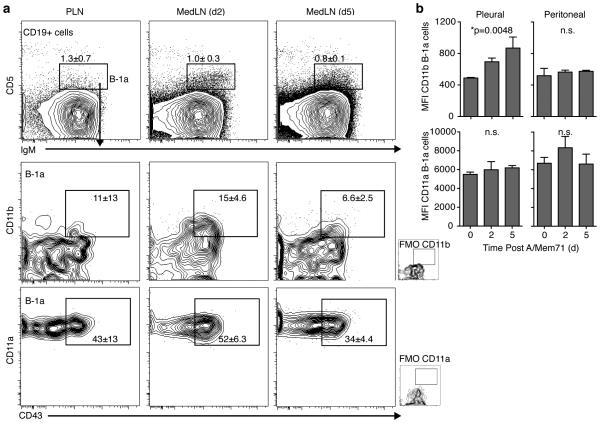
Figure 5. CD11b expression by recent B-1 cell lymph node immigrants.
(a) Shown are contour plots with outliers of CD11b and CD11a-expression after gating for live, non-dump, CD19+ cells (top) and gating for expression of IgM and CD5 to identify B-1a cells (lower panels) among MedLN cells from days 2 and 5 after infection with A/Mem71. Numbers indicate mean frequencies (± S. D.). FMO, fluorescent minus one control. (b) Mean fluorescence intensity (MFI, ± S. D.) of CD11a and CD11b expression by pleural and peritoneal B-1 cells at indicated times after infection. Student’s t-test: n.s., not significant; *p ≤ 0.05, **p ≤ 0.01, ***p ≤ 0.001, ****p ≤ 0.0001. Data representative of three experiments that gave similar results, n = 3 mice per group (a, b).

