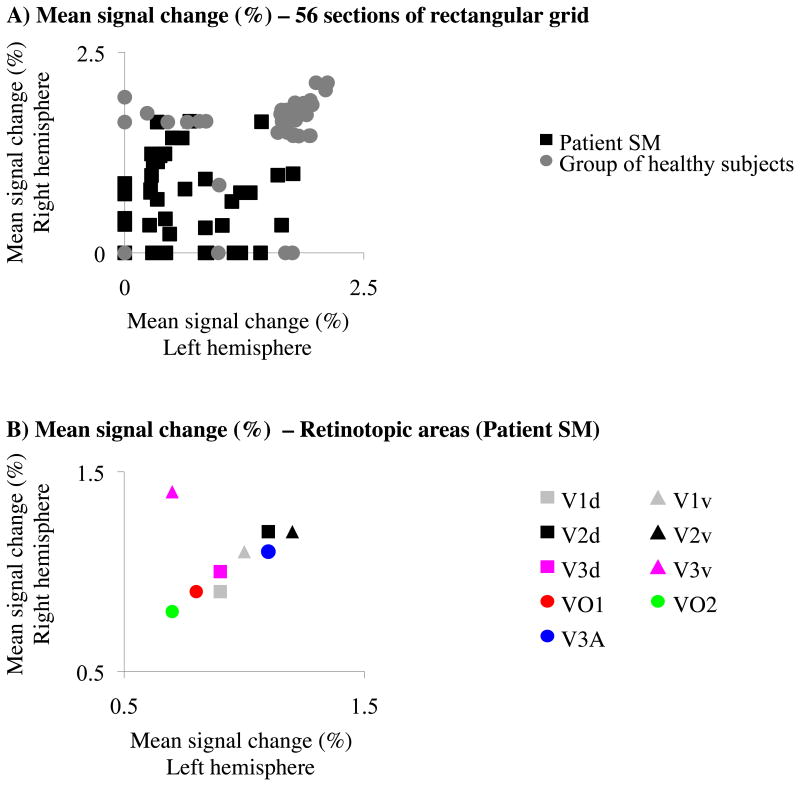
Figure 6. Inter-hemispheric correlations of visually-evoked responses in the group and SM. (A) Mean signal changes in the grid.
Unlike the control group, visually-evoked responses were not correlated between the two hemispheres of SM. (B) Mean signal changes of retinotopic areas. Similar to control subjects (see Supplementary Fig. 7), visually-evoked responses were correlated between the two hemispheres of SM. Data were volume-corrected (i.e., three voxels within a given grid-sector or 10 voxels within a given retinotopic area were randomly chosen among significantly activated voxels.

