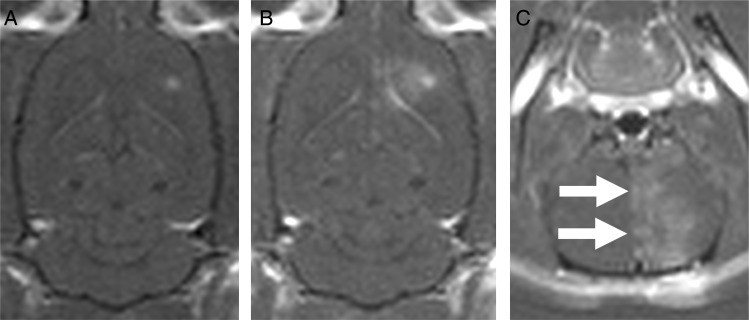
Fig. 2.
Representative images of blood-brain barrier disruption (BBBD). The contrast enhancement in the tumor before (A) and after BBBD (B and C) are shown. The focus is larger than the tumor size, so increased permeability is seen in the peritumoral area, favoring the medial aspect of the tumor due to the curvature of the rat skull. The coronal image (C) shows heterogeneity in the enhancement pattern due to standing waves. There was no difference in the enhancement after BBBD between the focused ultrasound (FUS) and FUS+Cells groups in either arm.

