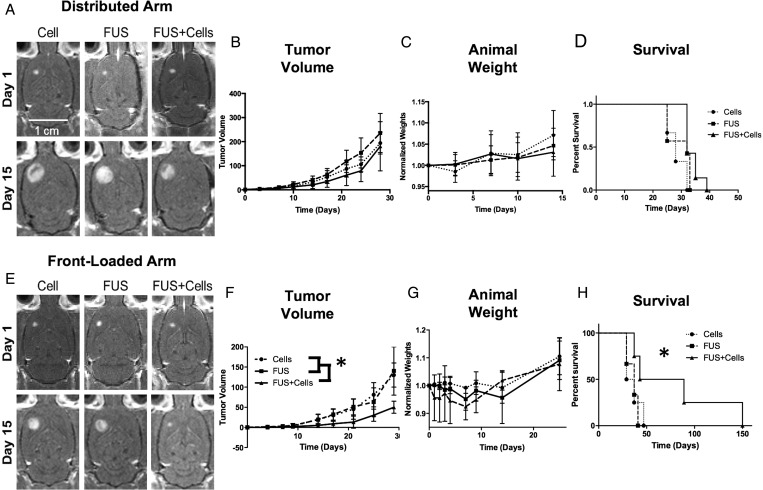
Fig. 3.
Comparison of the distributed and front-loaded treatment arms. A and E are representative contrast-enhanced T1 MR images of the tumor progression at 14 days. (B–D) The tumor volumes, animal weights, and survival data for the distributed arm. (F–H) Same data for front-loaded arm. F and H show significant reduction in tumor volume and increase in survival, respectively, achieved with an aggressive treatment schedule. (G) The front-loaded schedule was taxing on the animals. An initial weight loss was measured in the animals, whereas this was not observed in the distributed arm. Statistically significant results are denoted by *.

