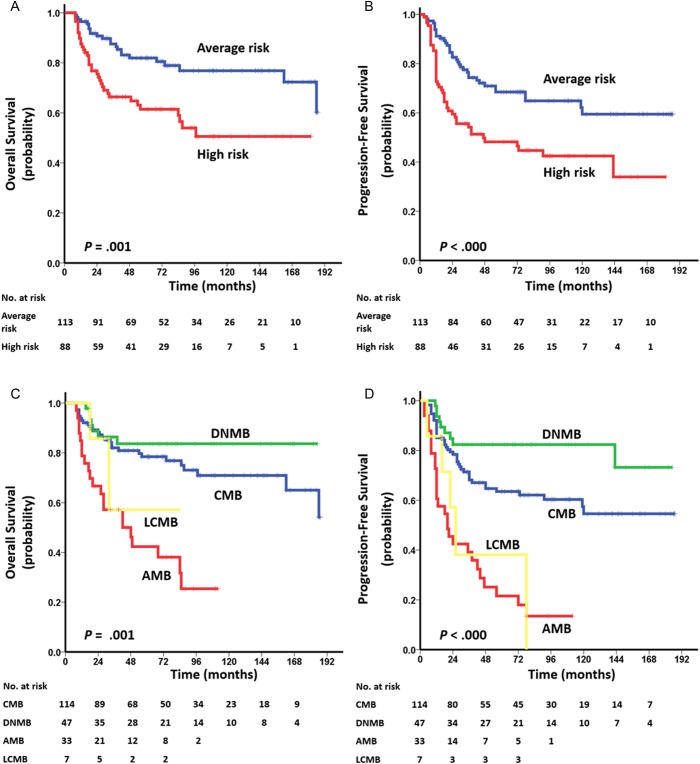
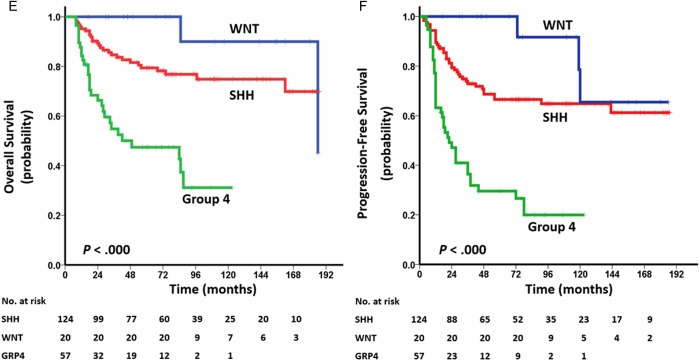
Fig. 2.
Kaplan–Meier plots of estimated OS (left side) and PFS (right side) time distributions for the 201-tumor cohort of adult MB according to: (A, B) risk staging: average risk vs high risk, (C, D) histology: classic vs desmoplastic/nodular vs anaplastic vs large cell, and (E, F) molecular subgroup: WNT vs SHH vs group 4. Survival differences are calculated using continuous log-rank tests.


