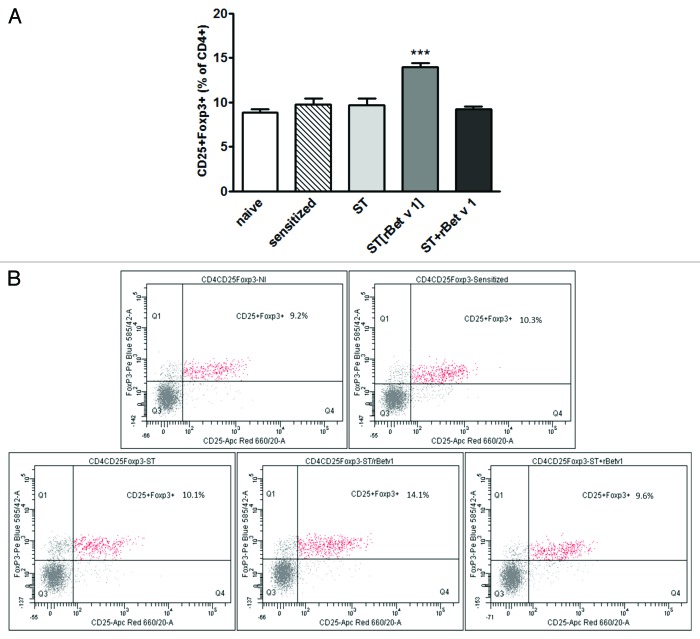
Figure 5. (A) Statistical analysis results from FACS data showing the Frequency of CD25+Foxp3+ (T reg cells) within the CD4+ subpopulation in each experimental group (mean ± standard deviation). ANOVA: ***P < 0.001(ANOVA) vs. all other groups; (B) Original FACS dot plots are shown for one representative mouse in each group. naïve: not sensitized, not treated mice; sensitized: sensitized, not treated mice; ST: wild type Streptococcus thermophilus-treated mice; ST[rBet v 1]: mice treated with recombinant Streptococcus thermophilus expressing rBet v 1; ST+rBet v 1: mice treated with recombinant wild type Streptococcus thermophilus and rBet v 1.

An official website of the United States government
Here's how you know
Official websites use .gov
A
.gov website belongs to an official
government organization in the United States.
Secure .gov websites use HTTPS
A lock (
) or https:// means you've safely
connected to the .gov website. Share sensitive
information only on official, secure websites.
